what’s in play screener: how to build a real-time trading bias using live data

what you'll learn in this guide
let's double down on the idea of combining multiple reports at once using our brand new what’s in play screener. here’s what you’ll have learned by the end of today’s deep dive into the what's in play screener:
- a step by step walkthrough of how I (André) use the what’s in play screener
- a clear understanding of how to use screener to develop a bias
- different ways to use the screener based on time of day
let’s go:
getting up to speed with our new what's in play screener
we've just dropped yet another massive upgrade on the edgeful platform — the what’s in play screener. to get set up, all you have to do is click the “screener” tab at the top of your edgeful dashboard. you’ll then see this:

on the left side of your screen, you’ll see our customization drop downs. here, you’re able to:
- choose your asset class (stocks, futures, or both)
- select which tickers you want (up to 49, and if we don’t have your favorite ticker listed, just let us know and we’ll add it!)
- choose the 4 reports you want to screen your selected tickers using
there we go, we’ve now covered the “what you get”. let’s make the screener more actionable for you (so you can actually start making money with it):
question: do you want to be like most traders (that fail)?
most traders enter the market with a predefined bias. "I feel bullish today" or "something just feels off". to be honest — using your emotions (rather than data) to build a bias is complete garbage.
with our screener, you'll develop your bias based on actual probabilities. if multiple reports across different tickers are flashing bearish signals, why on earth would you be bullish? if you were a profitable trader, you wouldn't. and that's the point.
here’s an example:

keeping this screener open throughout the day is like having your own personal quant sitting right next to you. it tells you exactly what's happening:
- multiple bearish signals across tickers? look to get active on the short side!
- clear bullish momentum building? time to get aggressive to the upside.
- no clear direction at all? stay out of choppy price action and go for a walk.
you don’t have to rely on what you think to be confident. you just trade off of data (more people need to do this anyways).
how I (André) personally use the what's in play screener
alright, lets make this email even more worth your time. I’m going to quickly show you exactly how I have the screener set up, and which reports/tickers I follow to develop my bias & trade ideas for the session. obviously yours can be different, but this is my personal set up & how I go about it: after 10:30 AM, I’m laser-focused on these four reports across my key tickers: reports i'm watching:
- gap fill
- initial balance standard
- opening candle continuation
- previous day's range
why these? because by 10:30ET, the day's bias becomes crystal clear. the initial balance is set (which are the two most important levels for my trading style), and I can see exactly how these reports are playing out across different markets.
tickers i'm tracking:
- magnificent 7 stocks (META MSFT AAPL TSLA NFLX NVDA GOOGL)
- SPY & QQQ
- ES & NQ futures
again — why these? while I’m primarily a futures trader, I love keeping tabs on the mag 7 stocks because those are the biggest names, with the most liquidity, that drive the market. I’m really just trying to develop a strong feel for the day’s action, and including the biggest individual stock names on my screener allows me to do that nearly instantly.
using the what's in play screener to build a bias in real-time
okay, you’ve got the list of stocks I look at and the reports I’ve got set up. now how do I use them to build an actionable bias for the session? as you can see in the example below, we’ve got a column on our IB - standard report that allows you to quickly analyze the bias based on how price action has played out across the tickers you’ve chosen.
using the what's in play screener to build a neutral market bias
for the 12 I follow, my bias was to be “neutral” for the day — not expecting a big move to the upside or downside (because price did not break above the initial balance high/low on majority of the names I track). and yes, 99% of the days break to one side or the other eventually, but it’s about having the patience to sit back and let price unfold. being too eager to trade is a great way to blow an account…

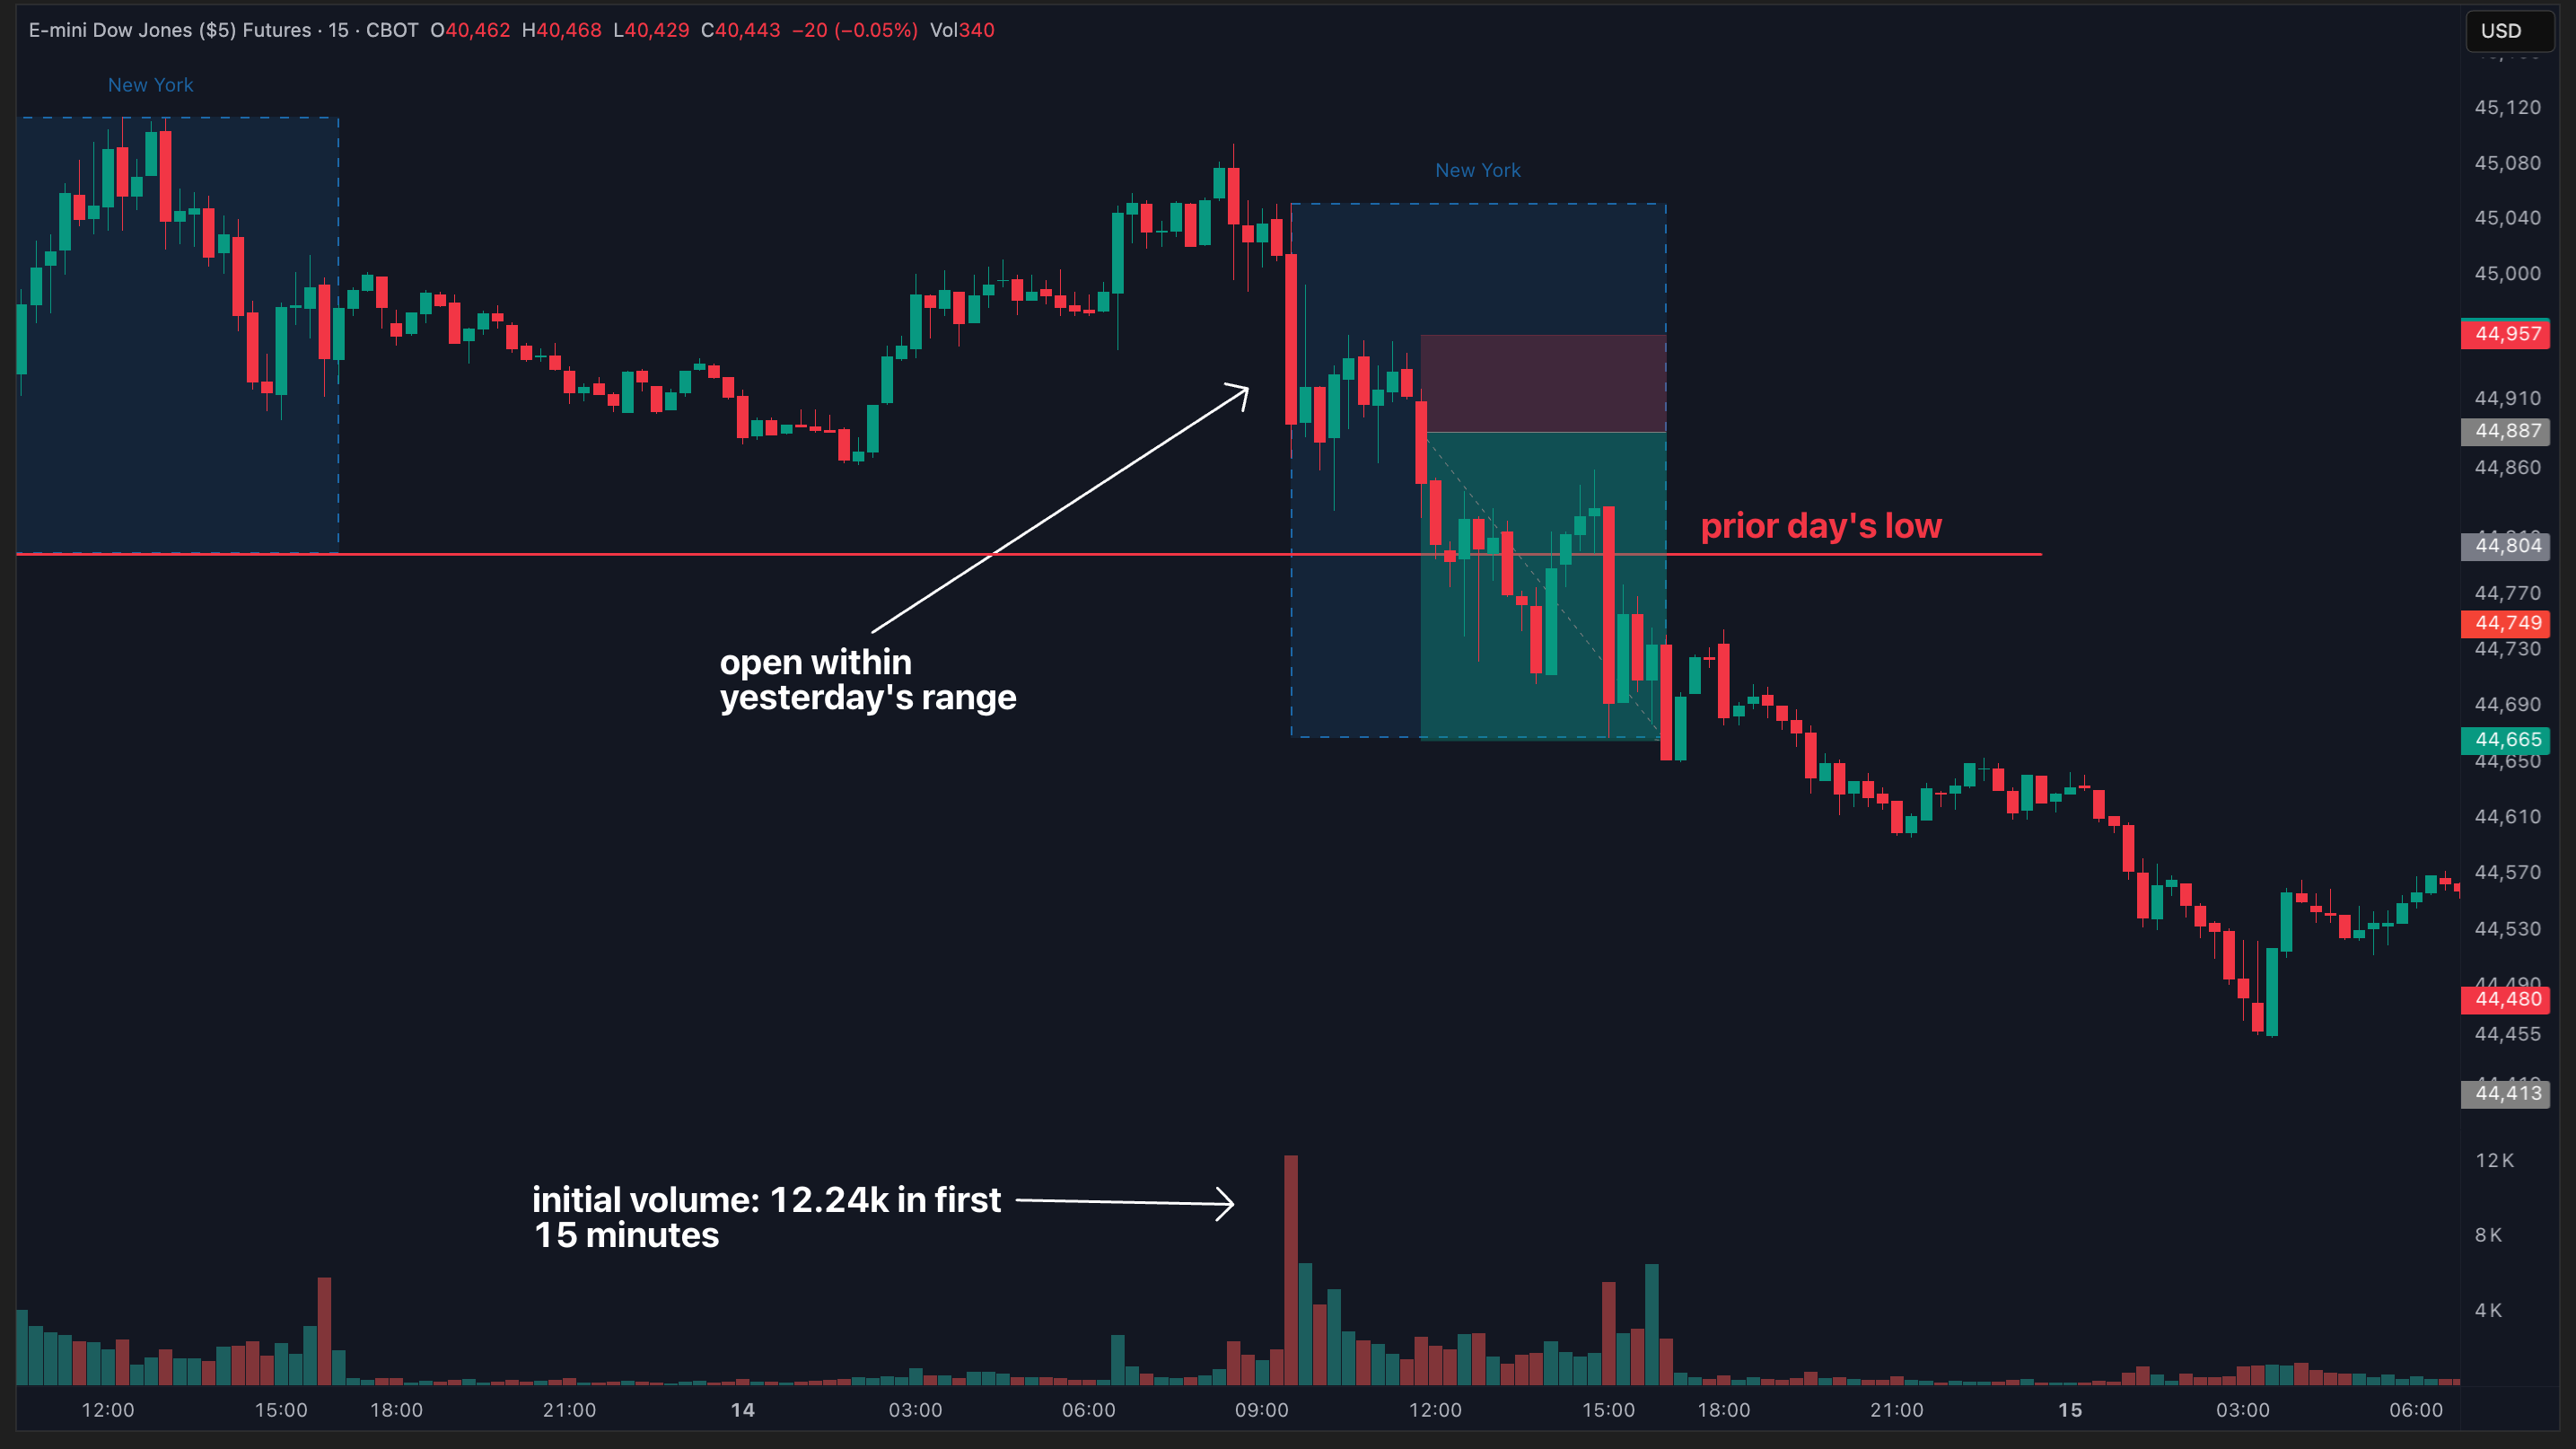
using the what's in play screener to build a bearish market bias
on the other hand — if the majority of the tickers I track had broken down through the IB low, it’s likely I would have been bearish for the day. our what’s in play screener tells you this info instantly:
and if the opening candle continuation report is ALSO bearish bias — there is absolutely zero question about which direction I should be focused on trading for the rest of the session:

really easy to build a directional bias when you use the screener like I’ve done above!
using the what's in play screener to build a bias based on the time of day
as I mentioned, those are the reports and tickers I’m focused on AFTER 10:30ET (and by the way — gap fill is almost always done by 10:30ET, but it holds a special place in my heart and was the report that started this company, so I keep it up during the day).
one thing you can do is build a template of reports to check back on based on the time of day. for example, let’s say you’re a first hour trader (like me). I would then only focus on these reports during the first hour (when the setups are likely to play out):
- the gap fill report (for quick trade opportunities)
- opening range breakout (for some more quick trade opportunities off the open)
- the outside day (for clear reversal targets)
- average daily range (another report to use to set targets or catch reversals)
and, if you’re an end of day trader, you can use these combos:
- power hour breakout (is price likely to make a new high or low during the last hour?)
- opening candle continuation (for where price will close)
- previous day’s range (also for where price will close)
the combinations really are endless, and we’re going to keep adding more reports for you to screen using intraday so you’ll be able to make decisions in a blink of an eye.
your step-by-step what's in play screener setup guide
okay boom! that was a high-level look at how to get used to the screener and some different combinations you can run to develop a bias and build an actionable trade plan for the day (using data).
here's where to go from here:
1. open your edgeful dashboard
2. navigate to the "screener" tab
3. click "customize screener"
4. select your 4 favorite reports (pro move: start with the ones I mentioned above)
5. add your top tickers (mine are the mag 7, SPY, QQQ, ES, NQ)
6. pin this tab and keep it open ALL DAY
massive. you've just upgraded your entire trading approach and can actually trade based on what price action is telling you, rather than what you think is going on. you’ve also got a home base to watch throughout the session (instead of getting distracted on X or something)... so, click the link below & start messing around with the screener tab. it’s time you started taking advantage of every powerful feature we’ve built for you — and the learning curve to master this one is basically instant.