gap fill trading strategy: trading gap fills with data-driven precision
what we're going to cover today:
- what gaps are (up & down) + how you can spot them
- one simple strategy to apply what you’ve learned so you can actually trade the pattern
- 5 bonus metrics to help you identify the best gaps to trade
let’s get going:
what are gaps?
when price opens higher or lower than the previous session’s closing (PSC) price, it's called a 'gap'.
- price opening higher than the PSC is a gap up.
price opening lower than the PSC is a gap down.
one thing to keep in mind: if you’re currently trading the NY session, you want to be referencing the previous NY session only. if you were trading the London session, you’d want to reference the prior London session’s close.
it's very important you have the right session selected when looking for this setup.
when do gaps occur?
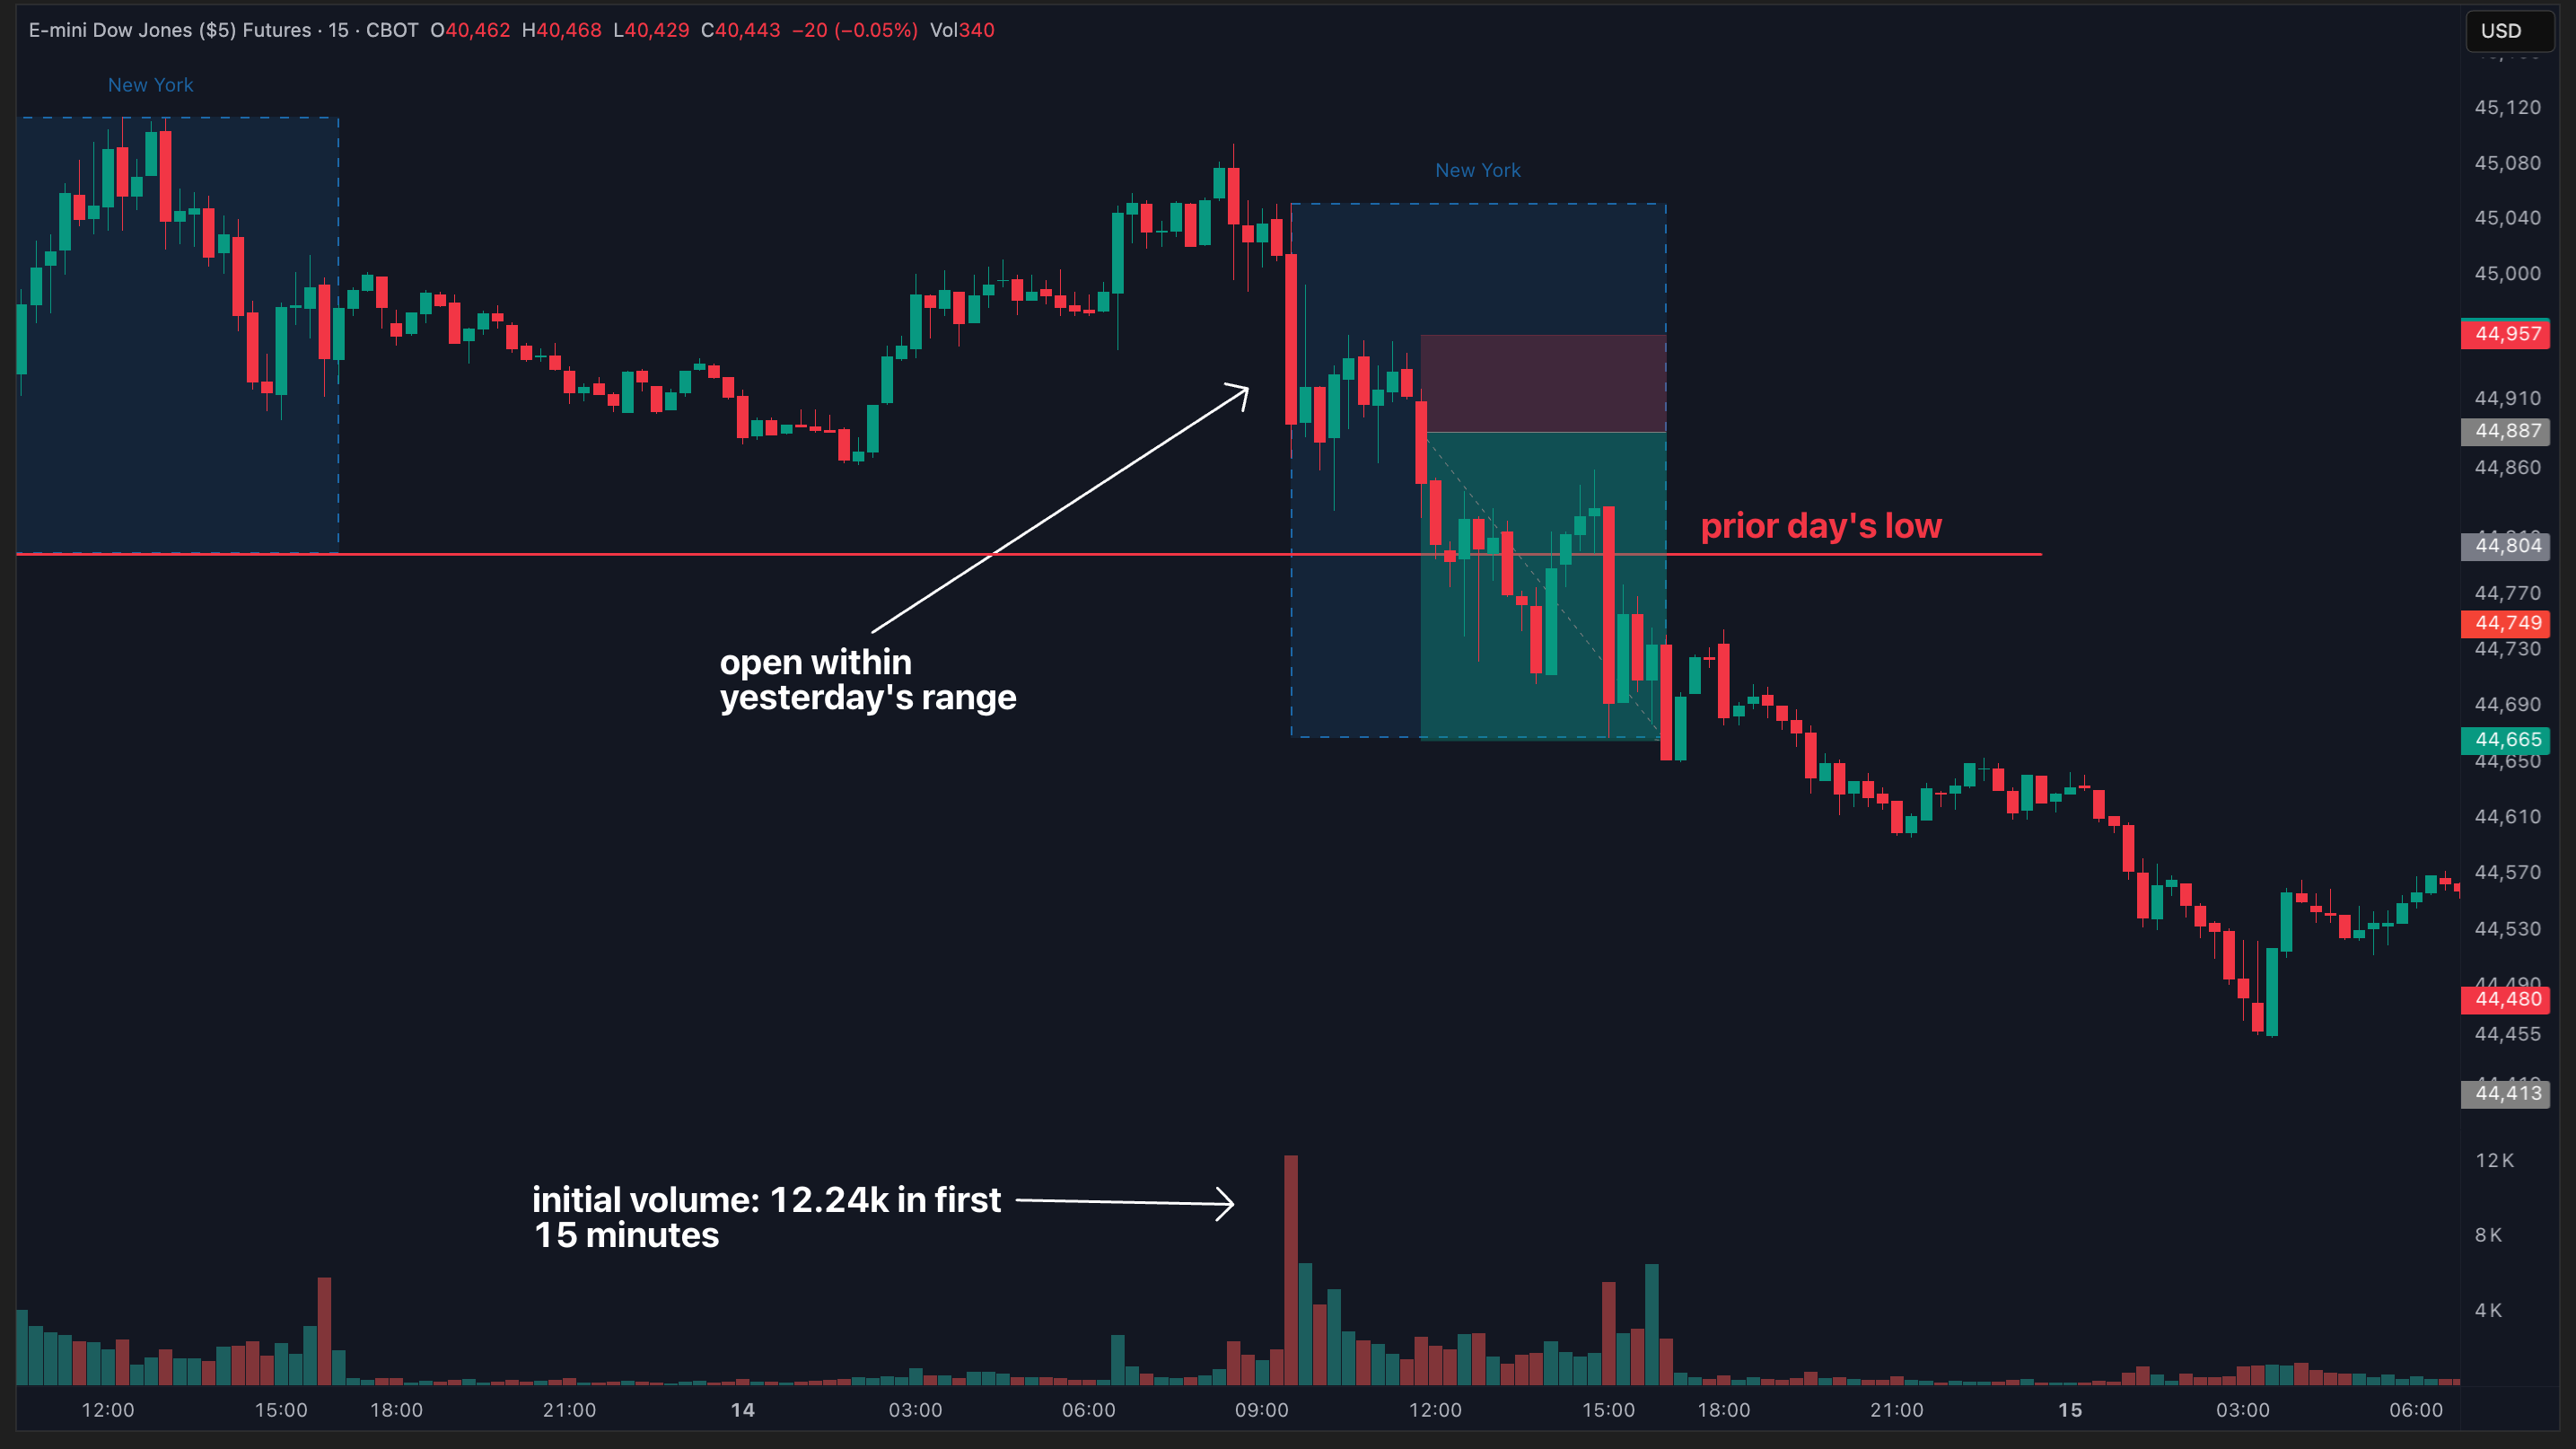
gaps show up on every single instrument, as long as you’re looking at regular trading hours, not electronic trading hours. you can see in the image below we’ve selected regular trading hours, and there are clear gaps that show up on the NQ from NY to NY session.

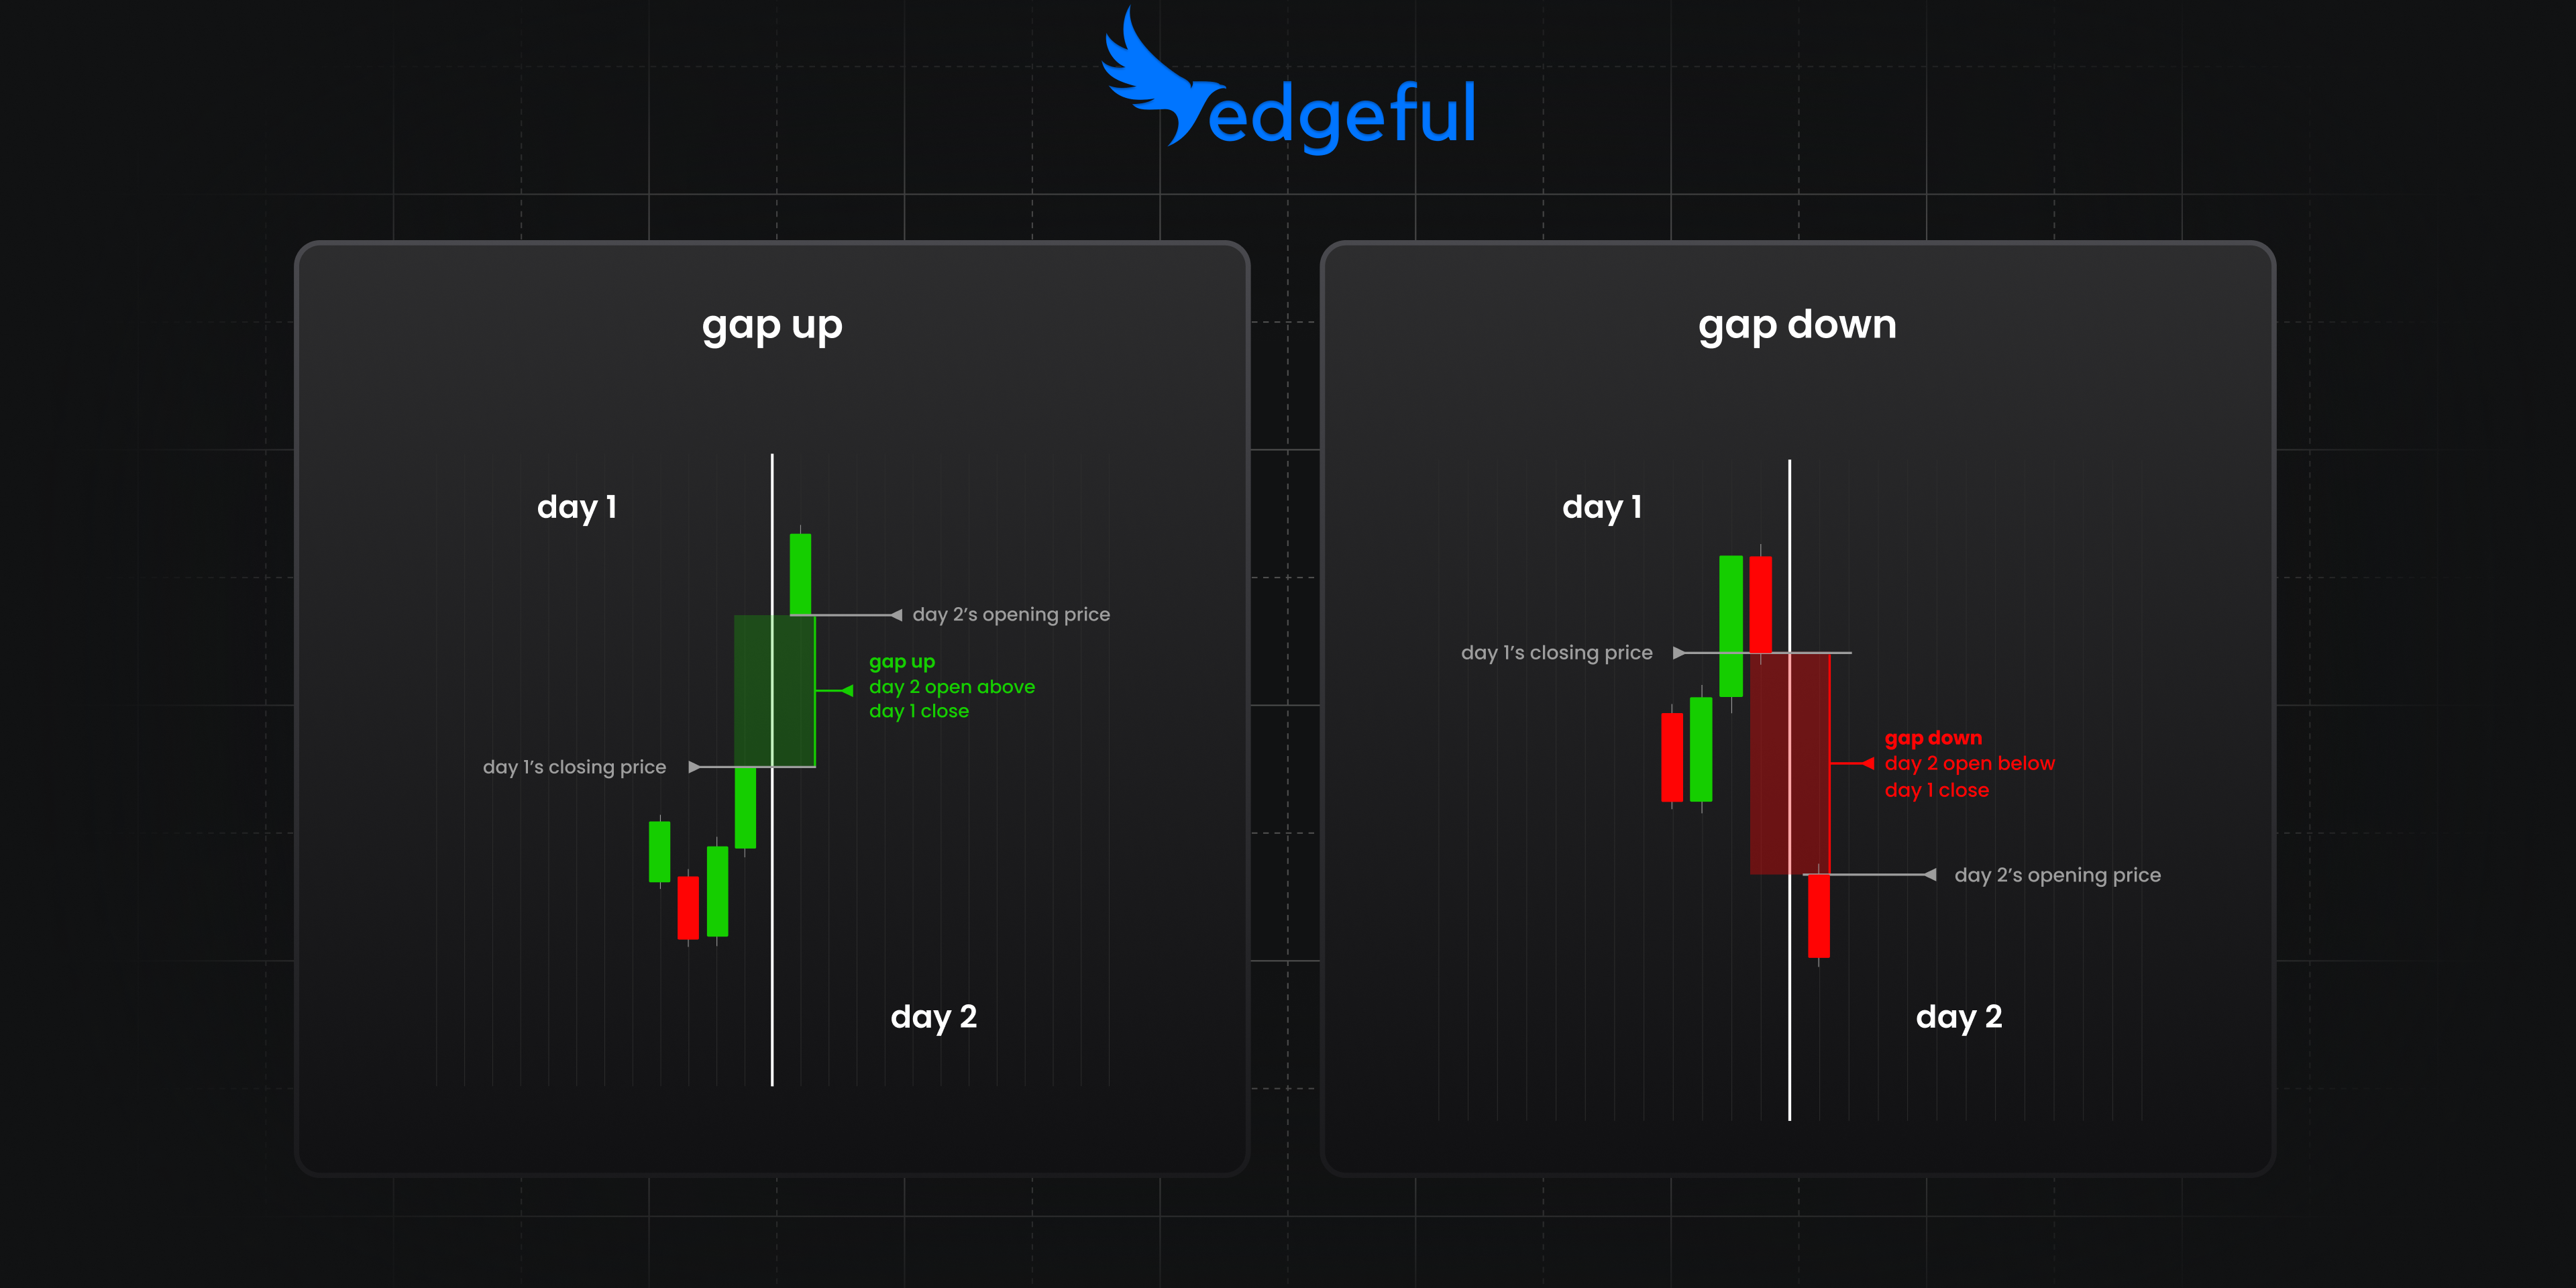
let's now take a look at the two types of gaps:
identifying gaps up & gaps down
as we already covered, gap ups happen when today's price on open is above the prior session's close (PSC). gap downs happen when today's price on session open is below the PSC.

what we want to dive deeper into is identifying patterns that occur after a gap up or gap down. more specifically, we’re going to be looking for a gap to...
1. fill
2. not fill
these two reactions form the foundation of a profitable gap trading strategy.
more on gap fills vs. gaps that don't fill
on a gap up, be watching for price to drop and touch the previous session’s close (PSC). if it does touch the PSC, this is considered a gap fill. if it doesn’t touch the PSC on the day of the gap up, that gap did not fill.
some visuals for you:

the image above is a gap fill — it can occur when today's open is above the prior session's close, and also when today's open is below the prior session's close. in both scenarios, price trades back towards the PSC.
here are two examples of how gaps can go unfilled:

you'll see that gaps from the prior session close can also go unfilled — where they do not test the prior session's close at all.
the only gap fill trading strategy you need
today’s actionable lesson is going to focus on how you can trade gap fills using the prior session’s close as a target area.
before we get there though, let’s take a look at some real world stats about gaps using edgeful’s data.

the above visual is a look at what our subscribers see in their edgeful toolbox.
- on the left sidebar, you'll see:
- we've chosen our asset to be 'futures'
- our ticker is 'ES'
- we're looking at the 'gap fill' report
- our date range is the last 6 months
what you then see highlighted are the gap fill stats for ES over our selected time period.
- over the last 6 months, gaps up on ES have filled 59% of the time
- over the last 6 months, gaps down on ES have filled 66% of the time
we can use these high probabilities to create a profitable gap fill strategy… which we’ll cover now:
edgeful's gap fill strategy
what we’re going to be looking for on our gap fill strategy is:
- a gap up
- the previous session’s close (PSC)
- data about what happens after the gap fills (more on this now!)
again, we’ve selected our market to be ‘futures’, our report to be ‘gap fill’, our ticker to be ‘ES’, and our date range to be ‘6-months’. but this time, we’ve filtered the data (blue arrow) to show ‘by close’, which means we’re looking at what happened after a gap got filled — did ES close green or red?

let’s break down the stats:
- a gap up on ES that fills has then closed green 56% of the time over the past 6-months
- a gap down on ES that fills has then closed green 58% of the time over the past 6-months
what this tells us is that if you’re a ES trader, and a gap fill occurs, over half of the time the end of day close will be green.
this is powerful, and we’ll take you through an example trade to show you why… here’s an example of ES from august 7th, 2024:

- potential short entry area: gap consolidation low (green line)
- potential stop loss area: above current day’s high (red line)
- potential target area: prior session’s close (PSC)
since we know that over 60% of the time when a gap up fills, ES closes green on the session (meaning it then rallies back above the prior session’s close), you don’t want to hold your short position hoping that price breaks below farther below the PSC. instead, use the PSC area as a target, and cover some if not all of your short position into this level.
let’s take a quick look at one more example, this time using NQ instead of ES.

for all of the times NQ has had a gap up fill, 53% of the time the close is green, meaning price ends above the prior session’s close (PSC). this tells us that using the PSC as our profit target is logical, and hoping to hold for a larger move below the PSC does not make sense based on the data.
NQ trade from September 26, 2024:

- potential short entry area: gap consolidation low (green line)
- potential stop loss area: above current day’s high (red line)
- potential target area: prior session’s close (PSC)
this is the exact same pattern as we originally saw with ES, this time with NQ. if you were to get emotional and have a random target or hope that price will continue lower from the PSC, you gave back a good amount of your gains. you didn’t listen to the data (knowing that a gap up that fills will close green over 60% of the time!).
walkthroughs like these are exactly why we’ve created stay sharp—provide you with education (now you have mastered gaps) and leave you with an actionable strategy, based on our data.
wrapping up today’s deep dive & 5 more metrics to track
tons of valuable education thrown at you today. let’s recap what you’ve now mastered:
- what are gaps (up & down)
- what are gap fills & gaps not filled
- the gap fill trading strategy
you can now start looking for these setups on your own, on a daily basis!
to wrap up this lesson, we wanted to show you how you can take trading gaps one step further with the data on edgeful.
you can also analyze gaps & their trade probabilities from 5 other points of view:
- by size
- by spike
- by fill time
- by weekday
- by previous candle
let’s quickly look at by weekday, comparing Monday's data vs. Wednesday's data.
Monday:

30% of the time over the last 6 months, gaps down fill on NQ on a Monday.
Wednesday's stats:

77% of the time over the last 6 months does NQ fill a gap down on a Wednesday! big difference between the two sessions — and using this data will help you identify a high probability gap vs. a low probability gap.
you can now see how laying the foundation with a chart pattern, then adding in real-world data for the tickers and setups you trade provides edge you never had access to before.
that's what we do here at edgeful.