opening range breakout (orb) trading strategy: how to trade the ORB setup with real market data
today we're taking a look at one of the most popular intraday trading setups, the opening range breakout (ORB) trading strategy. here's exactly what you're going to have mastered by the end of today's deep dive:
- what ORBs are and why they matter
- the different types of ORB trades
- how to use edgeful's data to build a killer orb trading strategy
- a step-by-step walkthrough of a high-probability orb trade
let's dive in!
what is an opening range breakout (ORB)?
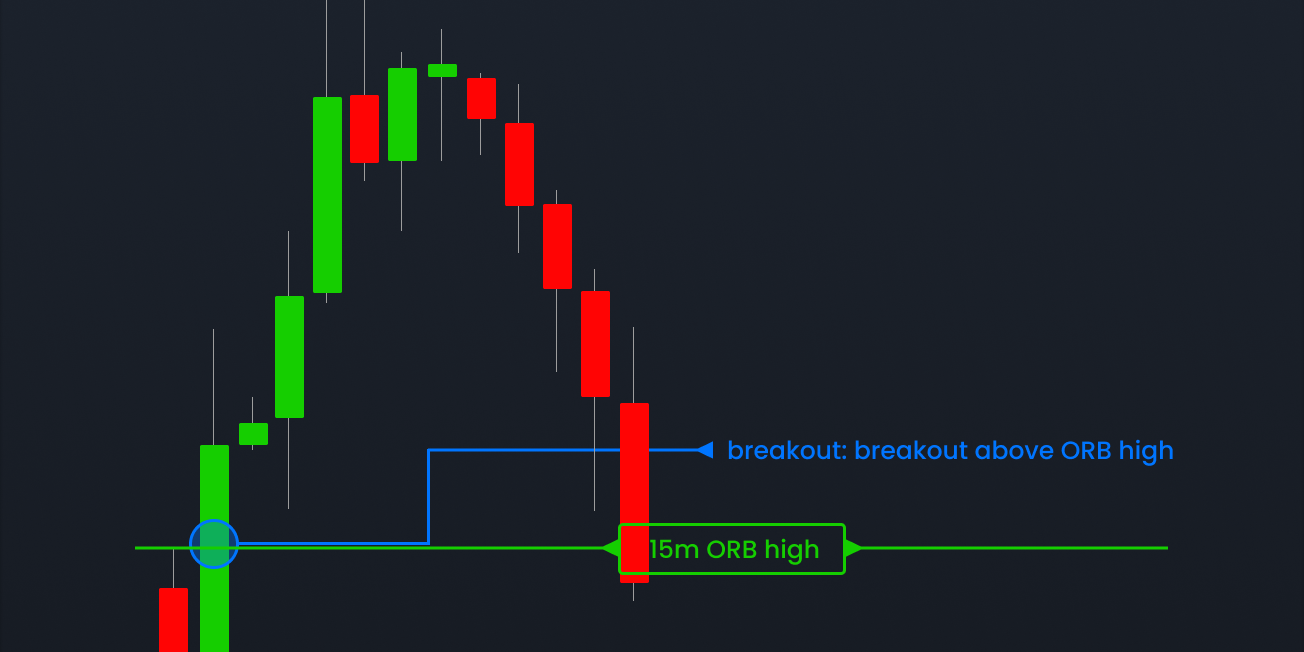
an opening range breakout/breakdown is based off the high & low of the first 5, 15, or 30-minute candle of the session. for US futures traders, this is the first candle that’s formed once the market opens at 9:30ET.
- a break above the opening range high is considered an opening range breakout.
- a break below the opening range low is considered an opening range breakdown.
here's a visual for you:

the opening range high and low act as levels that set the tone for the rest of the session, and while it would be nice for price to continue in the same direction as the breakout / breakdown, that’s often not the case.
in fact, price creates what we call a “double break” more than 60% of the time on ES over the past 6-months (more on this data in a little).

how to choose the best timeframe for your ORB strategy
when it comes to ORBs, one of the most important decisions you can make is what timeframe you choose. as we said before, the ORB can form on any intraday timeframe, but the most reliable are the 5-min, 15-min, or 30-min.
for the purpose of today’s lesson, we’re going to focus only on the 15-min ORB.
you can easily select your timeframe on any of our reports by using the "customizations" drop down on your report dashboard. it’ll then load this:

building a profitable ORB trading strategy with edgeful
here’s where we’re going to start:
- market: futures
- ticker: ES
- timeframe: 15min ORB
- session: New York
- lookback: 6-months

if you read our previous blog on gap fills, you’re already familiar with the report style above. our standard report is telling us that over the past 6-months….
- breakouts occur 16.92% of the time (move above OR high & don’t look back)
- breakdowns occur 16.15% of the time (move below OR low & don’t look back)
- double breaks occur 66.93% of the time (tag both the ORB low & high in the same session)*
a double break is the most frequent data point above, so it makes the most sense to build our ORB strategy on this pattern.
before we get into specific examples, we’re going to quickly cover one other report (ORB by levels) to help us identify where we should be taking profits/setting stop losses.
using the opening range breakout (ORB) by levels report to set targets and stops
we’re now going to take a look at the ‘by levels’ report of the ORB on edgeful. simply put, this report checks how often the price extends to specific multiples of the opening range (OR). to remind you, the opening range is just the high & low of the session’s first candle.
this report tracks price movements through intervals such as 0.5x, 1x, 2x, and up to 4x the OR range in both directions, helping you identify how far price tends to move beyond the opening range.

- over the past 6-months, the ES reaches a topside multiple of the opening range 0.5x 72% of the time
- over the past 6-months, the ES reaches a downside multiple of the opening range -0.5x 68% of the time
- less than 20% of the time does the ES extend above or below a -3.0x or 3.0x multiple*
we can use this data to help us determine:
- high-probability areas to take profits (what multiple of the OR does the ES extend to most often?)
- high-probability areas to catch reversals (if the ES is at -3.0x or 3.0x the OR, which happens rarely, what levels can we expect price to reverse?)
we’ll show clear examples of this in the application section of today’s lesson, which is next.
real world examples of the opening range breakout (ORB) strategy — the double break
so far, we’ve covered:
- the orb standard report
- the orb by levels report
let’s get actionable:
since the double break occurs 66.93% of the time (tag both the ORB low & high in the same session), this is the chart pattern we’re going to specifically focus on. we’re also going to use the by levels report to focus on key areas of extension that serve as our profit targets, as well as key areas for reversals.
example 1: October 25, 2024
ES had an opening range (from low to high on a 15-minute timeframe) of $11.75. after breaking above the OR high, ES would find selling at 1.6x multiple of the OR. since we know a double break occurs nearly 2/3 of the time over the past 6-months, we should be looking for a double break after the OR highs got undercut.

what you can then recognize is price finding resistance at the OR high before breaking lows. when we do break lows & register a double break setup, we can use these OR highs as a logical stop area for our short on ES.
let’s refer back to the data to find a profit target based on data, not your emotions:

the most logical profit target once we broke lows would have been in the -0.5x to -1.5x range, as these areas have occurred the most over the past 6mo. they also represent a solid multiple of your risk if you used the OR high as your stop loss area.
since price got all the way to -3.0x below the OR low, it was likely that we were going to find support/rally upwards as sellers cover or demand shows up. this would have been a smart place to cover, knowing that reaching -3.0x below the OR low is rare (only 19% of the time over the past 6mo…).
so now you’ve got yourself anywhere from 2-3R on this trade alone, all using edgeful data.
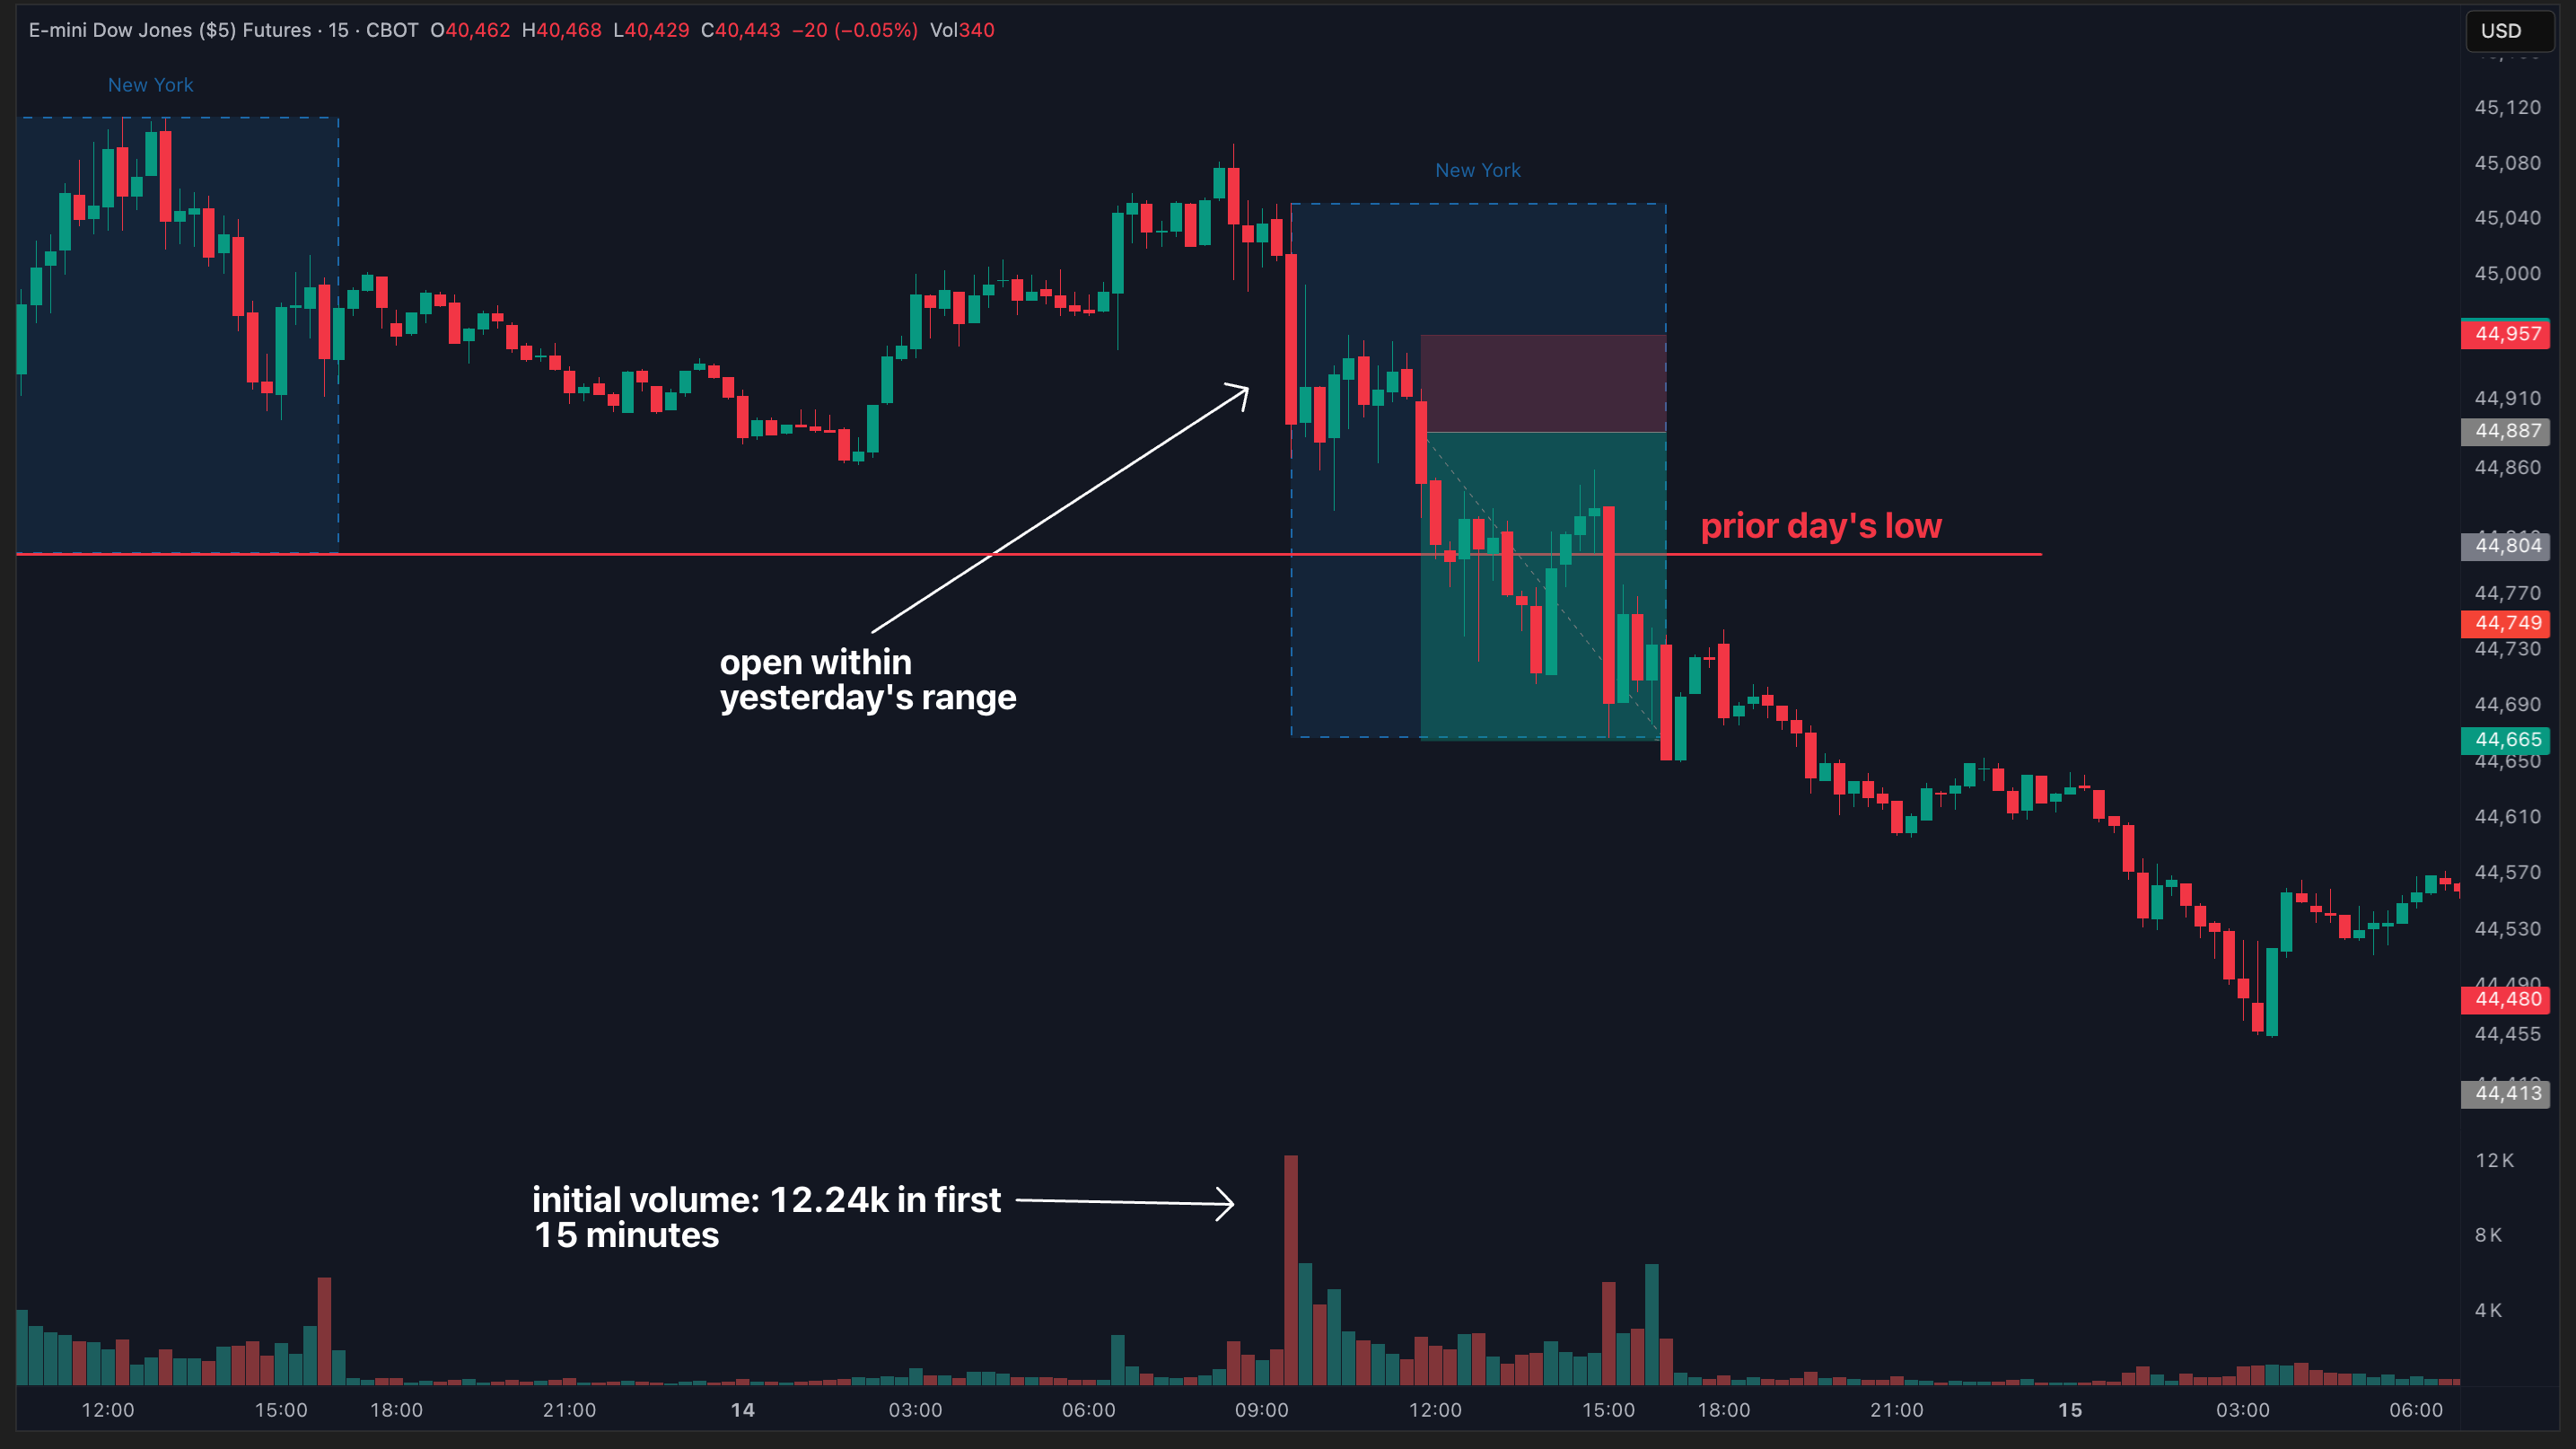
example 2: September 17th, 2024
this next example is going to combine the setup we learned last week when we covered gap ups, shorting a break of the daily lows looking for a gap to fill.

- we’ve gone back and checked the data on the ‘gap fill’ report for ES.
- over the past 6-months, a gap up on ES has filled 63% of the time.
knowing this, our bias coming into the session is to be looking for a double break to the downside, and then targeting the prior session close (PSC) for the gap to fill. let’s now walk through the below chart, step by step:

- in the above example, we have a gap up, a break of the low, and then a break of the high, which registers this setup as a double break.
- ES reached the 1.0x level of the opening range (about $10.5) before reversing, which happens 51% of the time based on the data we’ve already shared today.
- you could be short the OR low break that occurred mid session, looking to take profits at the gap fill (which was about -1.4x the opening range)
- you could have also left a runner on looking to take profits into a -2.0 or greater extension, which we ultimately got a -3.8x extension before rallying
see how having the data to know what's likely to happen next gives you edge? that's the power of our platform.
since we’ve covered a lot today, here's a quick refresher:
- opening range breakouts/breakdowns 101
- the different types of orb patterns (breakout, breakdown, double break)
- using edgeful's reports to build a data-driven orb strategy (example 1)
- combining two of edgeful’s reports to build a data-driven orb strategy (example 2)
the last thing we’ll leave you with today is a link to the reports we’ve mentioned. so if you’re an edgeful subscriber (or are looking to become one), you can access them instantly:
click here to access the orb report
click here to access the gap up report
if you’re not an edgeful subscriber yet, what are you waiting for? it’s time you take this education & actually apply it to your trading on a daily basis.