what's in play trading feature: use edgeful to identify high-probability setups instantly
the trader's biggest challenge: finding setups vs. executing them
as a trader, you know that time is money. the last thing you want is to spend hours searching for the perfect setup, only to miss it because you were too busy looking.
most traders face this dilemma daily: should you focus on finding setups or executing them? the truth is, you can't do both effectively without the right tools.
that's where "what's in play" comes in — a powerful feature designed to solve this exact problem by instantly alerting you when high-probability setups are forming across multiple reports.
what is "what's in play" and why does it matter?
"what's in play" is a real-time dashboard that monitors 13 of our most popular reports simultaneously:
- gap fill
- opening range breakout (ORB)
- initial balance
- average daily range (ADR)
and many more.

instead of manually checking each report throughout the day, "what's in play" gives you a consolidated view of all high-probability setups currently forming. this allows you to:
- save hours of analysis time
- focus on execution rather than discovery
- trade with confidence using data-backed setups
- avoid missing opportunities due to information overload
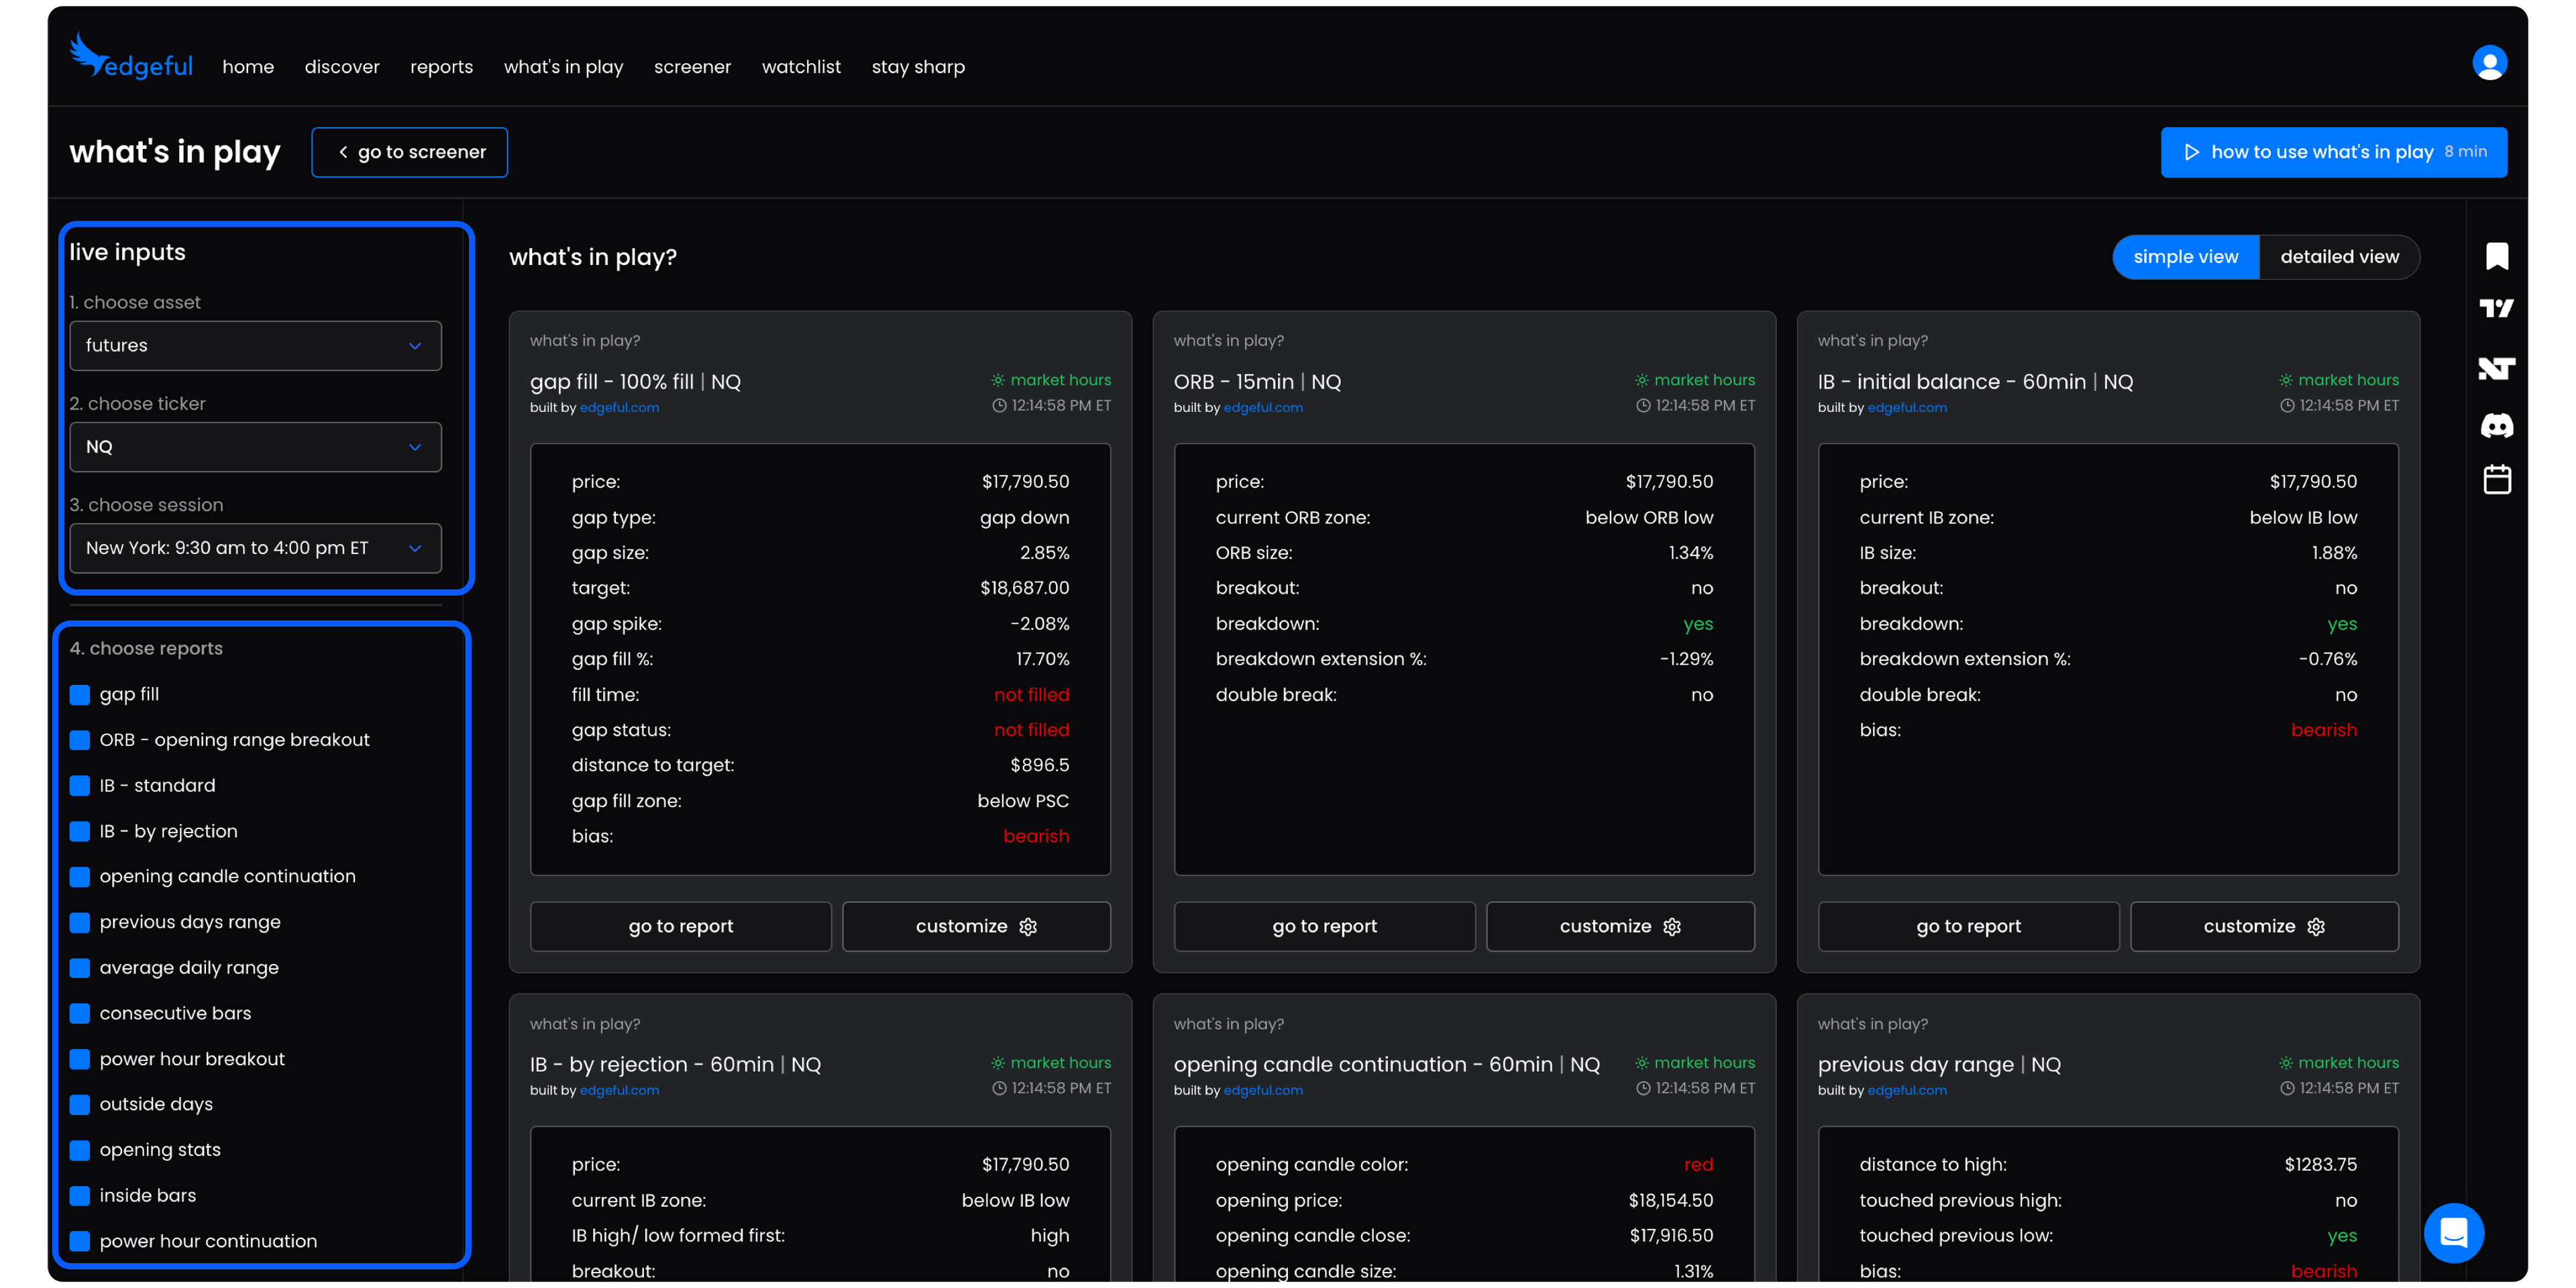
getting started with "what's in play" in 30 seconds
you can master using "what's in play" in just 30 seconds. here's how:
step 1: select your market type
choose between futures or stocks based on what you're trading today.
step 2: choose your ticker
select the specific instrument you want to analyze.
step 3: review the available reports
instantly see which high-probability setups are forming across all four reports.

it's that simple. in just a few clicks, you'll have a clear picture of what's setting up and where to focus your attention for the rest of the trading session.
understanding each report in "what's in play"
now that you know how to access "what's in play," let's dive into 3 different reports and how to interpret the data for profitable trading decisions.
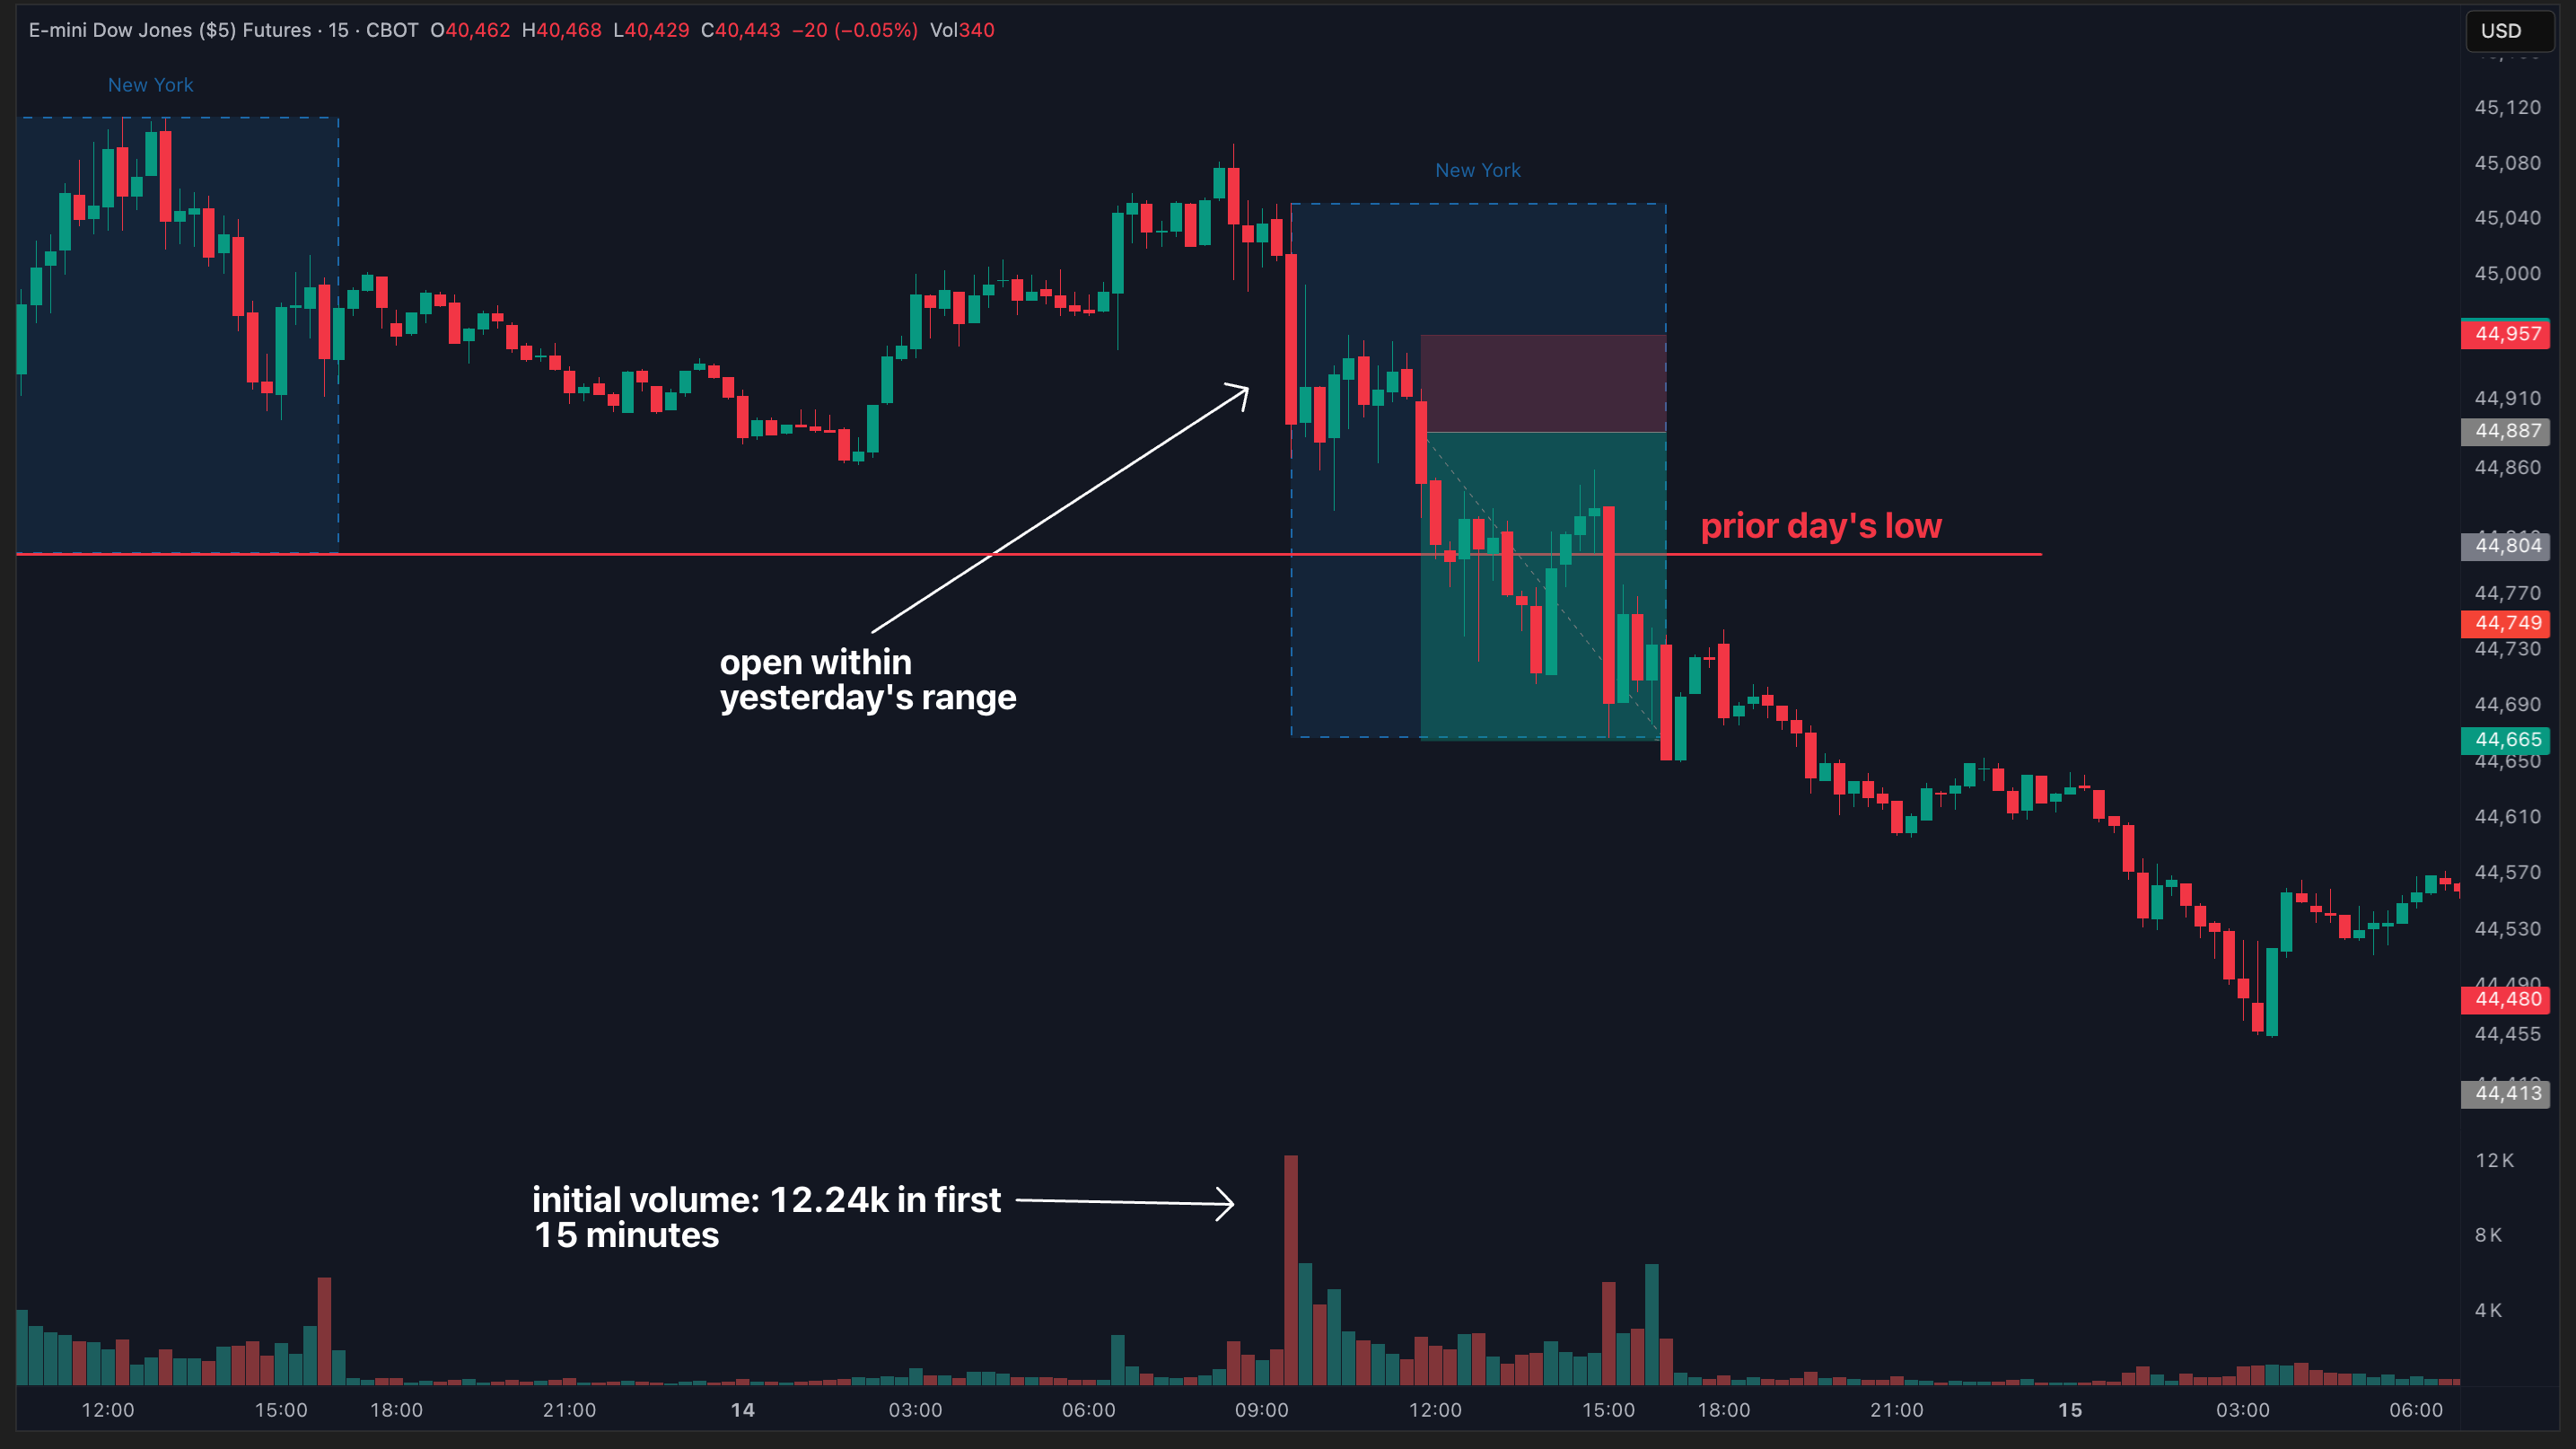
gap fill report
the gap fill report shows you:
- price: the real-time price of the ticker you've chosen
- gap type: is it a gap up or gap down?
- gap size: how big is the gap?
- target: what should your target be?
- gap spike: how much did price move away from the open before going to fill?
- gap fill %: how much of the gap has been filled?
- gap time: when did the gap get filled?
- distance to target
- gap status: is the gap filled or unfilled?
- gap fill zone: where are we relative to the gap fill area?
- bias: based on the gap direction and size, should you be looking for long or short setups?

for example, if you see an unfilled gap down with a history of recent gaps filling, you have a high-probability long setup targeting the previous session's close.
opening range breakout (ORB)
the ORB section provides:
- price: the current price of the ticker you select
- current price relative to the ORB zone
- ORB size: how large the range is between the high and low
- breakout vs. breakdown
- breakout vs. breakdown extension

when you see a tight opening range with high breakout probabilities, you can prepare for a potential breakout trade in either direction.
initial balance
the initial balance report displays:
- price: the current price of the ticker you've chosen
- current IB zone: the high and low established in the first hour of trading
- IB size: the size of the initial balance
- breakout vs. breakdown: did price break above or below the IB range?
- extension: how far above/below did the breakout/breakdown extend?
- bias: what bias you should have based on the action, and the stats
- "by rejection" sub-report: shows which side formed first and how that impacts breakout direction - a game-changer for predicting which way price will break

this report is particularly valuable for determining directional bias after the first hour of trading.
stacking probabilities: the real power of "what's in play"
the true value of "what's in play" comes from combining insights across multiple reports to identify setups with stacked probabilities.
for example, when you see:
- an unfilled gap (68% probability of filling)
- aligned with an opening range breakout in the same direction (75% probability)
- plus initial balance rejection data supporting the same move (78% probability)
you're no longer trading a single setup with a 68% edge - you're trading a combined setup with significantly higher probabilities of success.
this ability to quickly identify stacked setups is what separates consistently profitable traders from the rest. "what's in play" makes this process effortless, even for busy traders who can't monitor multiple reports continuously.
making "what's in play" work for your trading
to get the most out of "what's in play," follow this simple framework:
- check it first thing when markets open to see what's setting up
- focus on stacked setups where multiple reports align in the same direction
- set alerts for key levels identified by the reports
- check back periodically throughout the session as new setups form
- use the reports together - don't rely on just one in isolation
by making "what's in play" part of your daily routine, you'll dramatically reduce the time spent searching for setups and increase the time spent executing profitable trades.
wrapping up: transformed trading in 30 seconds
"what's in play" represents a fundamental shift in how traders can approach the markets. instead of spending hours analyzing multiple reports and charts, you can now:
- identify high-probability setups in seconds
- focus your energy on execution rather than discovery
- trade with confidence using data-backed probabilities
- stack multiple edges for higher win rates
the most successful traders aren't necessarily those who work the hardest - they're the ones who work the smartest by using the right tools at the right time.
"what's in play" is designed to be that essential tool in your trading arsenal, helping you identify what's actually worth trading each day so you can focus on what matters most: executing with confidence.
want to experience the power of "what's in play" for yourself? start your edgeful subscription today and transform how you find and execute high-probability trades.