the ultimate bullish setup: how to combine 4 edgeful reports into one high-conviction trade on NQ
step 1: the reports you need to master our ultimate bullish setup
alright, here we go. let’s cover the 4 reports you’ll need to know to master our ultimate bullish setup.
- report #1: inside bars
- report #2: opening candle continuation
- report #3: initial balance
- report #4: initial balance by retracement
put together — you’re looking at an 80% win rate. it's ridiculous...
before I break down each one of the reports, it's very important to mention that the ultimate bullish setup is only valid on NQ during the NY session. so everything I cover from here on out will be using NQ during the NY session.
report #1: inside bars
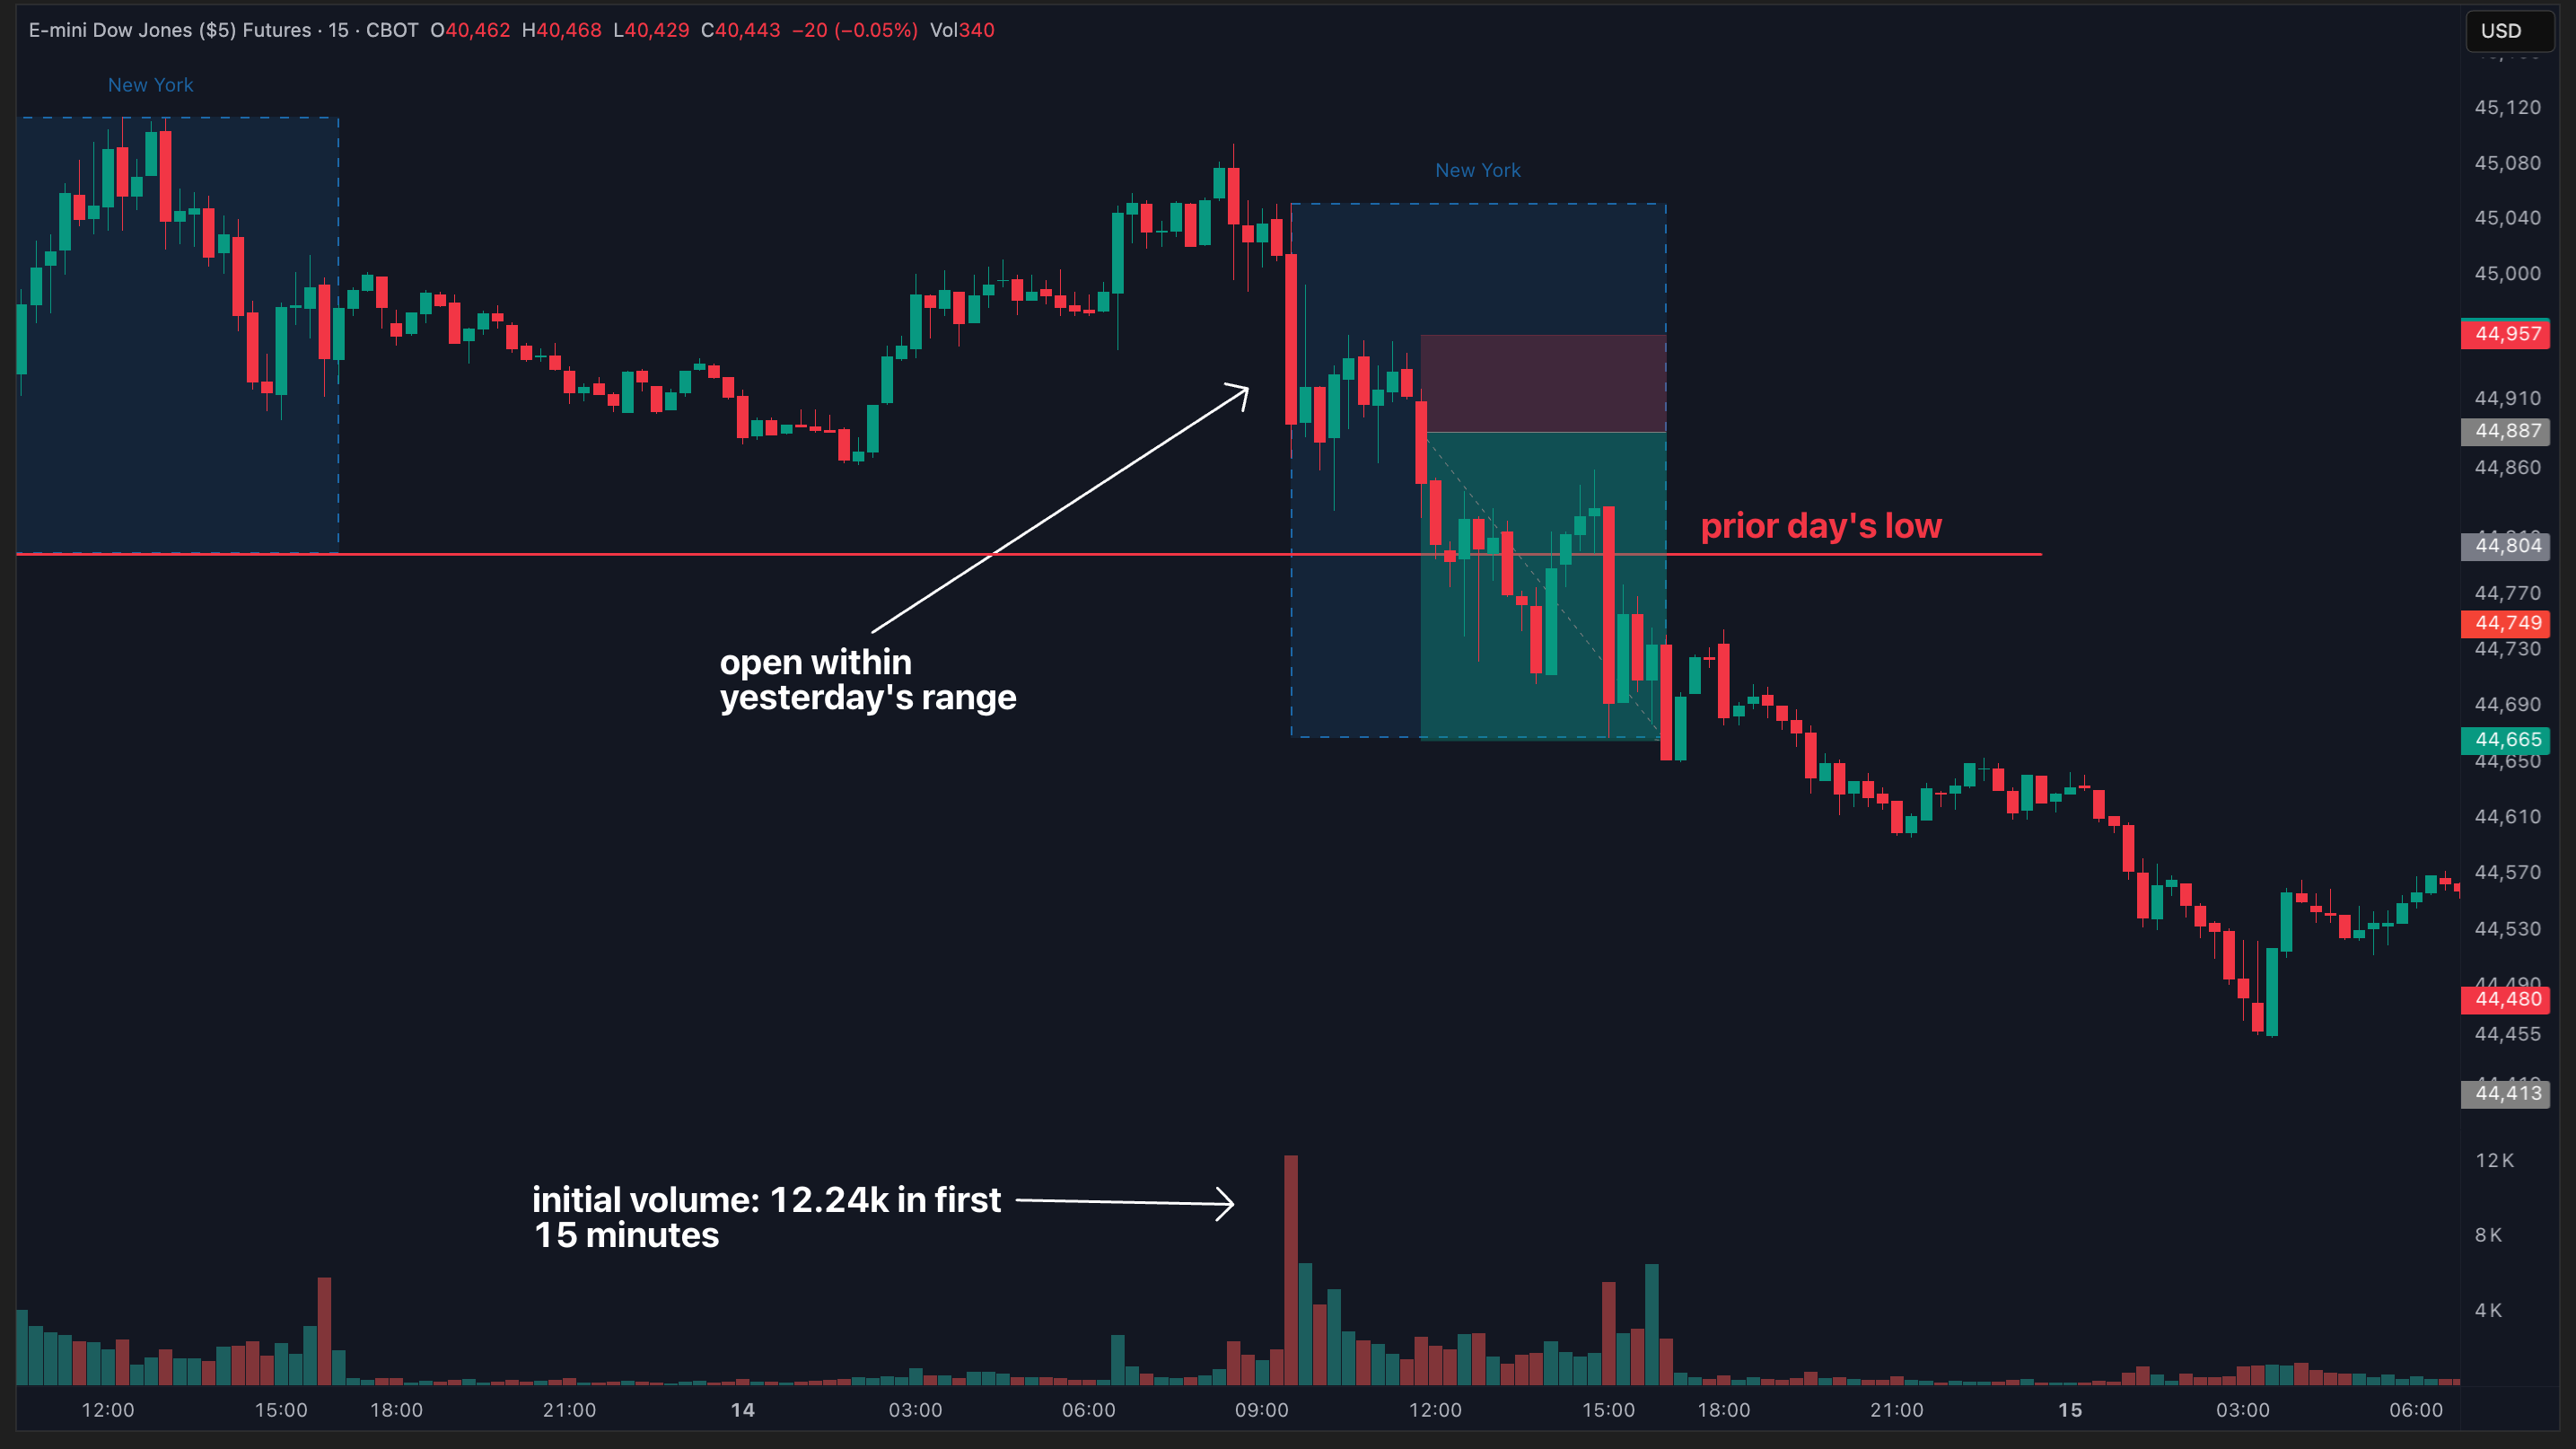
alright... this report is where it all starts. the inside bars report measures how often price breaks out of yesterday's high or low.

this is the first thing you need to check when price opens at 9:30AM ET. if price isn't opening within the prior day's high and low (triggering an inside bar), there's no point to taking this trade.
let's check the stats for NQ, which is our ticker of focus today:

according to the inside bars report, there's a ~75% chance NQ will test the previous day's high or low if price is to open within the prior day’s range.
this is undeniably strong data — and we're going to use it to set our profit targets for this ultimate bullish setup.
report #2: opening candle continuation
the opening candle continuation report measures the chances of the day closing in the same direction as the first hour candle (9:30–10:30am ET).
in other words, if the first hour is green, how often does the day close green?

on NQ, over the last 6 months, that probability has been a staggering 84%:

this tells us that when the first hour of the NY session on NQ closes green, our bias must be bullish. since we have a bullish bias — we should be expecting this momentum to carry higher throughout the NY session — which means we should use yesterday’s high as our target for the ultimate bullish setup.
quick recap:
- check to see if we're opening within yesterday's range (inside bar)
- wait for the first hour to close — if the first hour is green, have a bullish bias
but we’re not all the way there yet — we still need to cover how to set a data-backed entry and stop loss. that’s where the initial balance breakout report comes in:
report #3: initial balance
the initial balance (IB) is the range established in the first hour of trading. since we are focused on the NY session for this setup, the IB high and form from 9:30—10:30AM ET. after the IB is set, price can do one of 3 things:
- break either the IB high or low — this is a single break
- break both the IB high and low — this is a double break
- stay within the IB range — this is a no break
here's what a single break looks like visually:

this is a single break because price only breaks one side of the IB range — and in this case it was the IB high. single breaks do not come back to touch the other side of the IB range during the NY session.
here's a double break:

this is a double break because price first breaks out of the IB high, and then also breaks below the IB low within the same NY session.
no break:

this is a no break because price stays within the IB high and low for the entire NY session.
here are the key stats from the IB report on NQ over the last 6 months:

- 82% of the time, NQ breaks the IB range in only one direction — this is a single break day.
- 16% of the time, NQ breaks the IB range in both directions — this is a double break day
- 1.55% of the time, NQ stays completely within the IB range for the entire session
this means that there’s a very high probability that NQ will break out of only one side of the IB range — the high or low — and not come back to break the other side.
what this means is that we can use the direction of the first break to add further confidence in our bias for the session — remember, 82% of the time when price breaks above the IB high, it does not come back to break the IB low.
it’s extremely important that you wait for the first break of the IB range before taking any trades using this setup. and since this is ultimate bullish setup, we need price to break above the IB high before we can consider entering. I’ll cover the exact entry, stop loss, and profit target criteria in a second, but remember to always wait for a break through the IB high before taking a trade using the ultimate bullish setup.
so just to make sure we’re still on the same page…
- if price opens within yesterday's range, ~75% of the time it breaks yesterday's high/low
- if the first hour is green, 83% of the time the session closes green
- if price breaks above the IB high, 82% of the time it won’t break the IB low
so we’ve now combined 3 separate reports, all near or above 80%, to give us a:
- target — use the inside bars report
- bias — use the OCC report
- more bias — use the IB report & wait for the IB high to break
we can now cover the initial balance by retracement report, which is going to give us our entry and stop loss for the ultimate bullish setup.
report #4: initial balance by retracement
the initial balance by retracement report will act as the glue to the entire ultimate bullish setup — giving you clear entry and stop loss levels to use. before we get into specifics, let’s quickly cover what “by retracement” means.
the IB by retracement subreport checks how far price retraces back into the IB range after breaking one side of the IB range (while still being a single break day).
based on the stats you’re about to see — it’s very common for price to come back into the IB range after breaking out, while still being a single break day, which means we can use this report to find a high probability area to enter and set a stop, within the IB range.
before we go any further, here’s what each retrace level looks like on the charts:
to keep it simple, we focus on two main retracement levels — the 25% and the 50% — which will be our entry and stop loss. here’s what each retrace level looks like on the charts:

the blue line above is the 25% retracement level, which is one quarter of the way back down into the IB range from the IB high. so if the IB range is 50 points on NQ, the 25% retrace level would be 12.5 points below the IB high.
the red line above indicates the 50% retracement level — one half of the way back down from the IB high to low. so if the IB range is 50 points on NQ, the 50% retrace level would be 25 points below the IB high.
based on the stats you are about to see, we are going to use these levels to set a data-backed entry and stop loss:

the IB by retracement subreport breaks that data into breakout vs. breakdown stats, which makes it incredibly easy to focus on only the relevant data for this setup. since we’re looking for a breakout of the IB high, the data above represents retracement levels only on breakouts above the IB high, or breakout days. here's what the data is telling us for NQ:
- the 25% retracement level is hit 65% of the time — a very high probability — which makes it a great entry level
- the 50% retrace level is hit 26.67% of the time — a low probability — which makes it a great stop loss level
the best part is these levels set up every single day, and are based on the IB range, so you literally never have to worry about where you’re going to enter/exit your trades. it’s all based on data, and we calculate them for you (more on this later).
so to recap:
- we know our targets for the trade are going to be either the previous session’s high or low (inside bar report) – hopefully to the high, because this is the bullish setup.
- we use the opening candle continuation report — the color of the first hour on the NY session — to determine our bias for the rest of the session & tell us which level from the previous session’s range to target
- the direction of the first break of the IB range — this is the bullish setup, so the IB high — needs to be in the same direction as the opening candle which should be green.
- we wait for a break — we are looking for a break back into the IB high — and then look for price to move back into the 25% retrace level on the IB range, this is our entry
- we set our stop below the 50% retrace level — only 25% of the time price reaches this level after breaking above the IB high
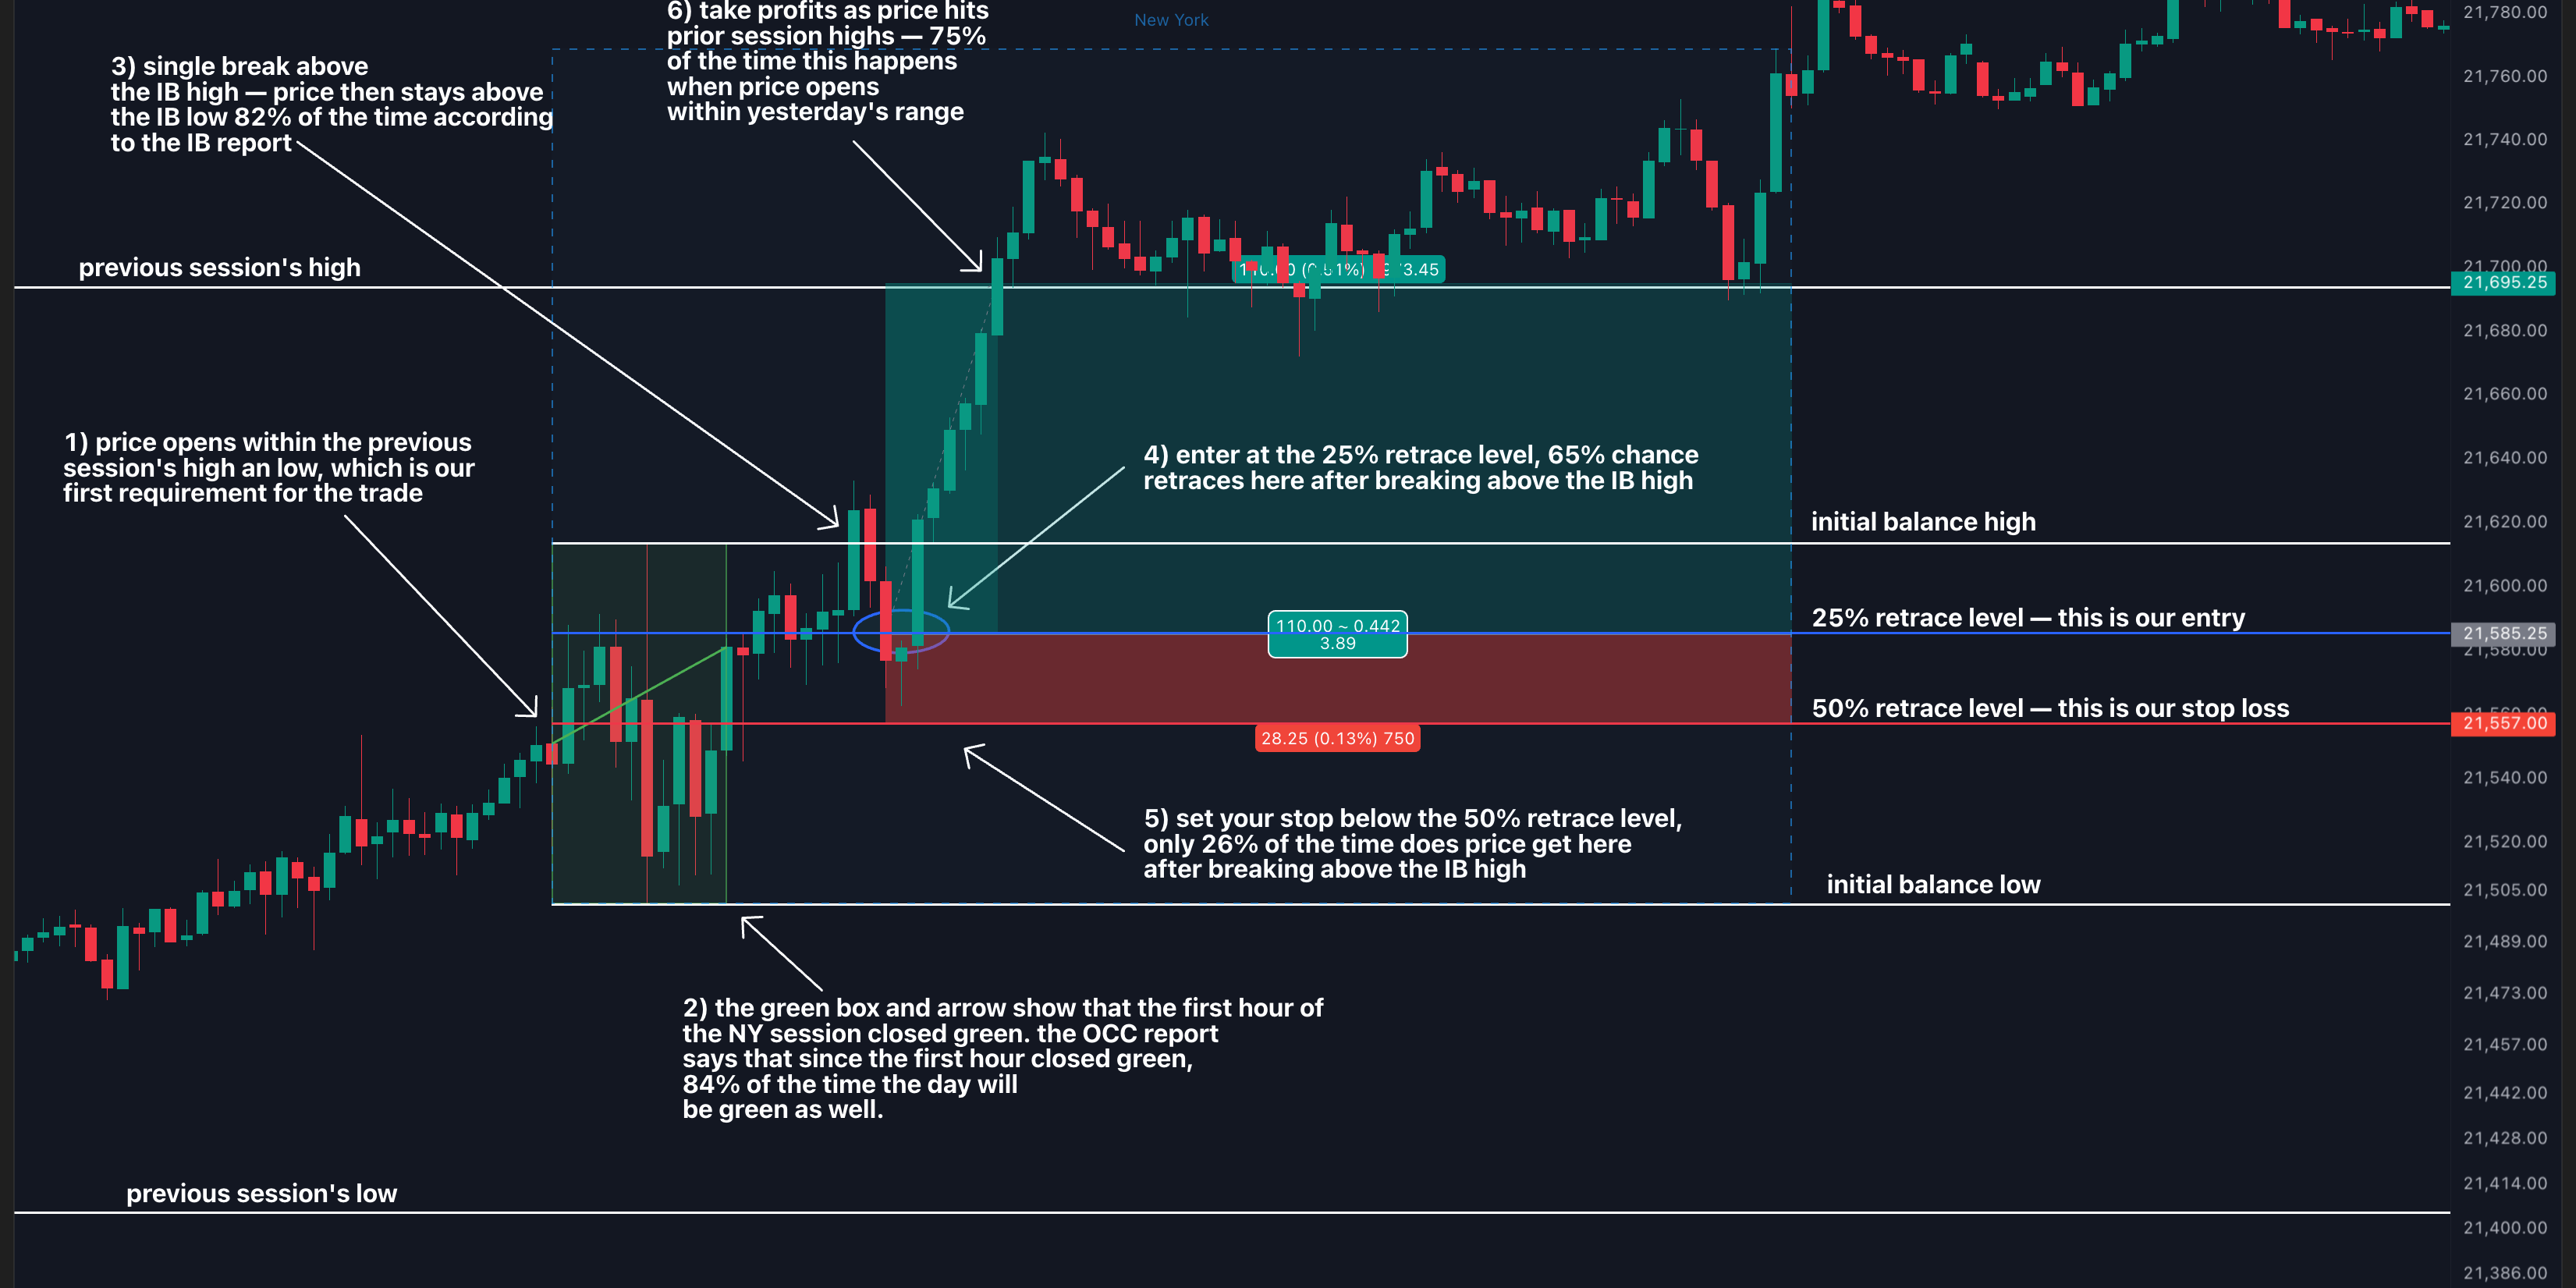
let’s put it all together now with an example on NQ, from February 5, 2025:
step 2: what the ultimate bullish setup looks like on NQ
here’s the trade, with everything we’ve covered already labeled directly on the chart:

let’s walk through it step by step:
1) NQ opens within the prior NY session’s high and low.
75% of the time over the last 6 months, NQ has tagged either the prior NY session’s high or low when it open inside of the prior session’s range. this means we can now use either yesterday’s high or yesterday’s low as a target — but we don’t know which one it’s going to be yet.
2) the first hour’s close is green — and using the opening candle continuation (OCC) report — we can determine our bias and which side of yesterday’s range to target — bullish & yesterday’s high.
NQ’s first hour close — from 9:30AM - 10:30AM — is green, which tell us we should have a bullish bias for the session. and because we expect this bullish momentum to carry throughout the rest of the session, we should use the prior session’s high as our target for the trade.
3) NQ breaks above the initial balance high at 11:05AM, which confirms our bullish bias
we are bullish because over the last 6 months on NQ, price breaks only one side of the IB range 84% of the time. since price breaks out above the IB high in this example, it is very unlikely to reverse to the IB low by the end of the NY session.
BUT, we are not entering on this breakout. this is where our 25% retracement level comes in:
4) after waiting for the break above the IB high, we look to enter at the 25% retracement level
based on the IB by retracement report, we know 65% of the time price will come back into the IB range and test this level after breaking above the IB high. this makes it a very high probability entry, and is much better than entering right on the breakout because we can avoid some drawdown, and also because of how tight we can set our stops:
5) after entry, we use the 50% retracement level as a low risk stop loss
using the IB by retracement report, we know after price breaks above the IB high, only 26% of the time will it also come back to touch the 50% retracement level (while still being a single break day). this is low probability — and tells us that below the level, it is likely our bullish bias is wrong and we should exit the trade, making this level a great stop loss.
6) take profits using the previous session’s high
and now we’re back to our first report — the inside bars report. since we knew price has tagged yesterday’s high or low 75% of the time when opening inside the prior session’s range, the previous session high acts as a strong, data-based target. our bullish bias from the OCC report added to our conviction, as well as the IB report once we broke above the IB high. and there you go — the result of our ultimate bullish setup was nearly a 4R trade.
aside from the fact that we’ve combined multiple reports, all with very strong probabilities, the ultimate bullish setup is an A+, home run trade because we are only risking 25% of the IB range, and can lose incredibly small when we’re wrong. and when we’re right, it’s very likely this trade turns into a 3, 4, or even 5R trade!
this is hard to replicate and doesn’t come around very often, which is why when it does set up, you can swing for the fences with confidence.
step 3: setting up your what's in play dashboard to track this setup
now, I know what you might be thinking. "this sounds great, but how do I keep track of all these reports in real-time?" that's where what's in play comes in.

on the left side of the what’s in play dashboard, simply select the IB standard and opening candle continuation reports. you can also select the previous day's range report to check yesterday's levels. we also have the opening stats report where you can see if we’re set to open within yesterday’s range (replaces the inside bars report while we get it added to the what’s in play dash).
you can use these to instantly track the important levels we’ve talked about today — without having to scramble for them as soon as the session starts, or as soon as the first hour of trading finishes.
we calculate everything for you — so all you have to do is focus on executing.
you can then use the watchlists to jump between your favorite tickers and analyze if the setup we’ve covered above on NQ is legit across other symbols as well.
don’t forget about our TradingView indicator that plots the retracement levels for you too – it’s called “edgeful – IB – initial balance”.
putting it all together
there you go... a simple 4-report process that consistently results in over 80% win rate when the signals align.
before you go run the reports for yourself, here’s a quick checklist to follow:
- ✅ check the inside day report — did we open inside yesterday’s range?
- ✅ watch the first hour — is the candle green?
- ✅ define the initial balance high/low — watch for a breakout
- ✅ if price breaks above the ib high, enter a small position
- ✅ look for a retrace to 25% retracement — that’s your size-up zone
- ✅ set a stop just below the 50% retracement
- ✅ target the previous day’s high
with screen time and a few reps, this strategy becomes second nature. when you spot an inside day, you’ll know:
the ultimate bullish setup could be in play.