power hour breakout trading strategy: why new highs & lows rarely happen in the final hour
debunking the power hour myth
if you've been trading for any length of time, you've probably heard about the "power hour" - the final 60 minutes of the trading day from 3:00 PM to 4:00 PM ET. conventional wisdom suggests this is when institutional money makes its biggest moves, leading to new highs or lows of the day.
but what if that conventional wisdom is wrong?
in this post, we're going to challenge the common misconception about power hour and show you how to use actual data to:
- set more realistic profit targets throughout the trading day
- identify high-probability reversal opportunities when the market tries to make new extremes late in the session
what is the power hour breakout?
the "power hour" refers to the final hour of the trading session, typically from 3:00 PM to 4:00 PM ET. many traders believe this is often a time of high volatility in the direction of the day's trend, or that late-day institutional buying/selling will push the market to new high of days (NHOD) or new low of days (NLOD).
but the data tells a completely different story.
the surprising truth about power hour
let's look at what the power hour breakout report tells us about several popular trading instruments:
tesla (TSLA) - past 6 months:

the data shows that over the past 6 months, a NHOD or NLOD during power hour only happens 20% of the time on TSLA. that's shockingly low compared to what most traders believe.
dow futures (YM) - past 6 months:

for futures traders, the numbers are slightly higher but still far from what conventional wisdom would suggest. YM futures make new extremes during the final hour only about 15-20% of the time.
gold futures (GC) - past 6 months:

gold futures show a similar pattern:
- 85% of the time over the last 6 months, GC has not made a new high during the last hour of trading
- 91% of the time over the last 6 months, GC has not made a new low during the last hour of trading
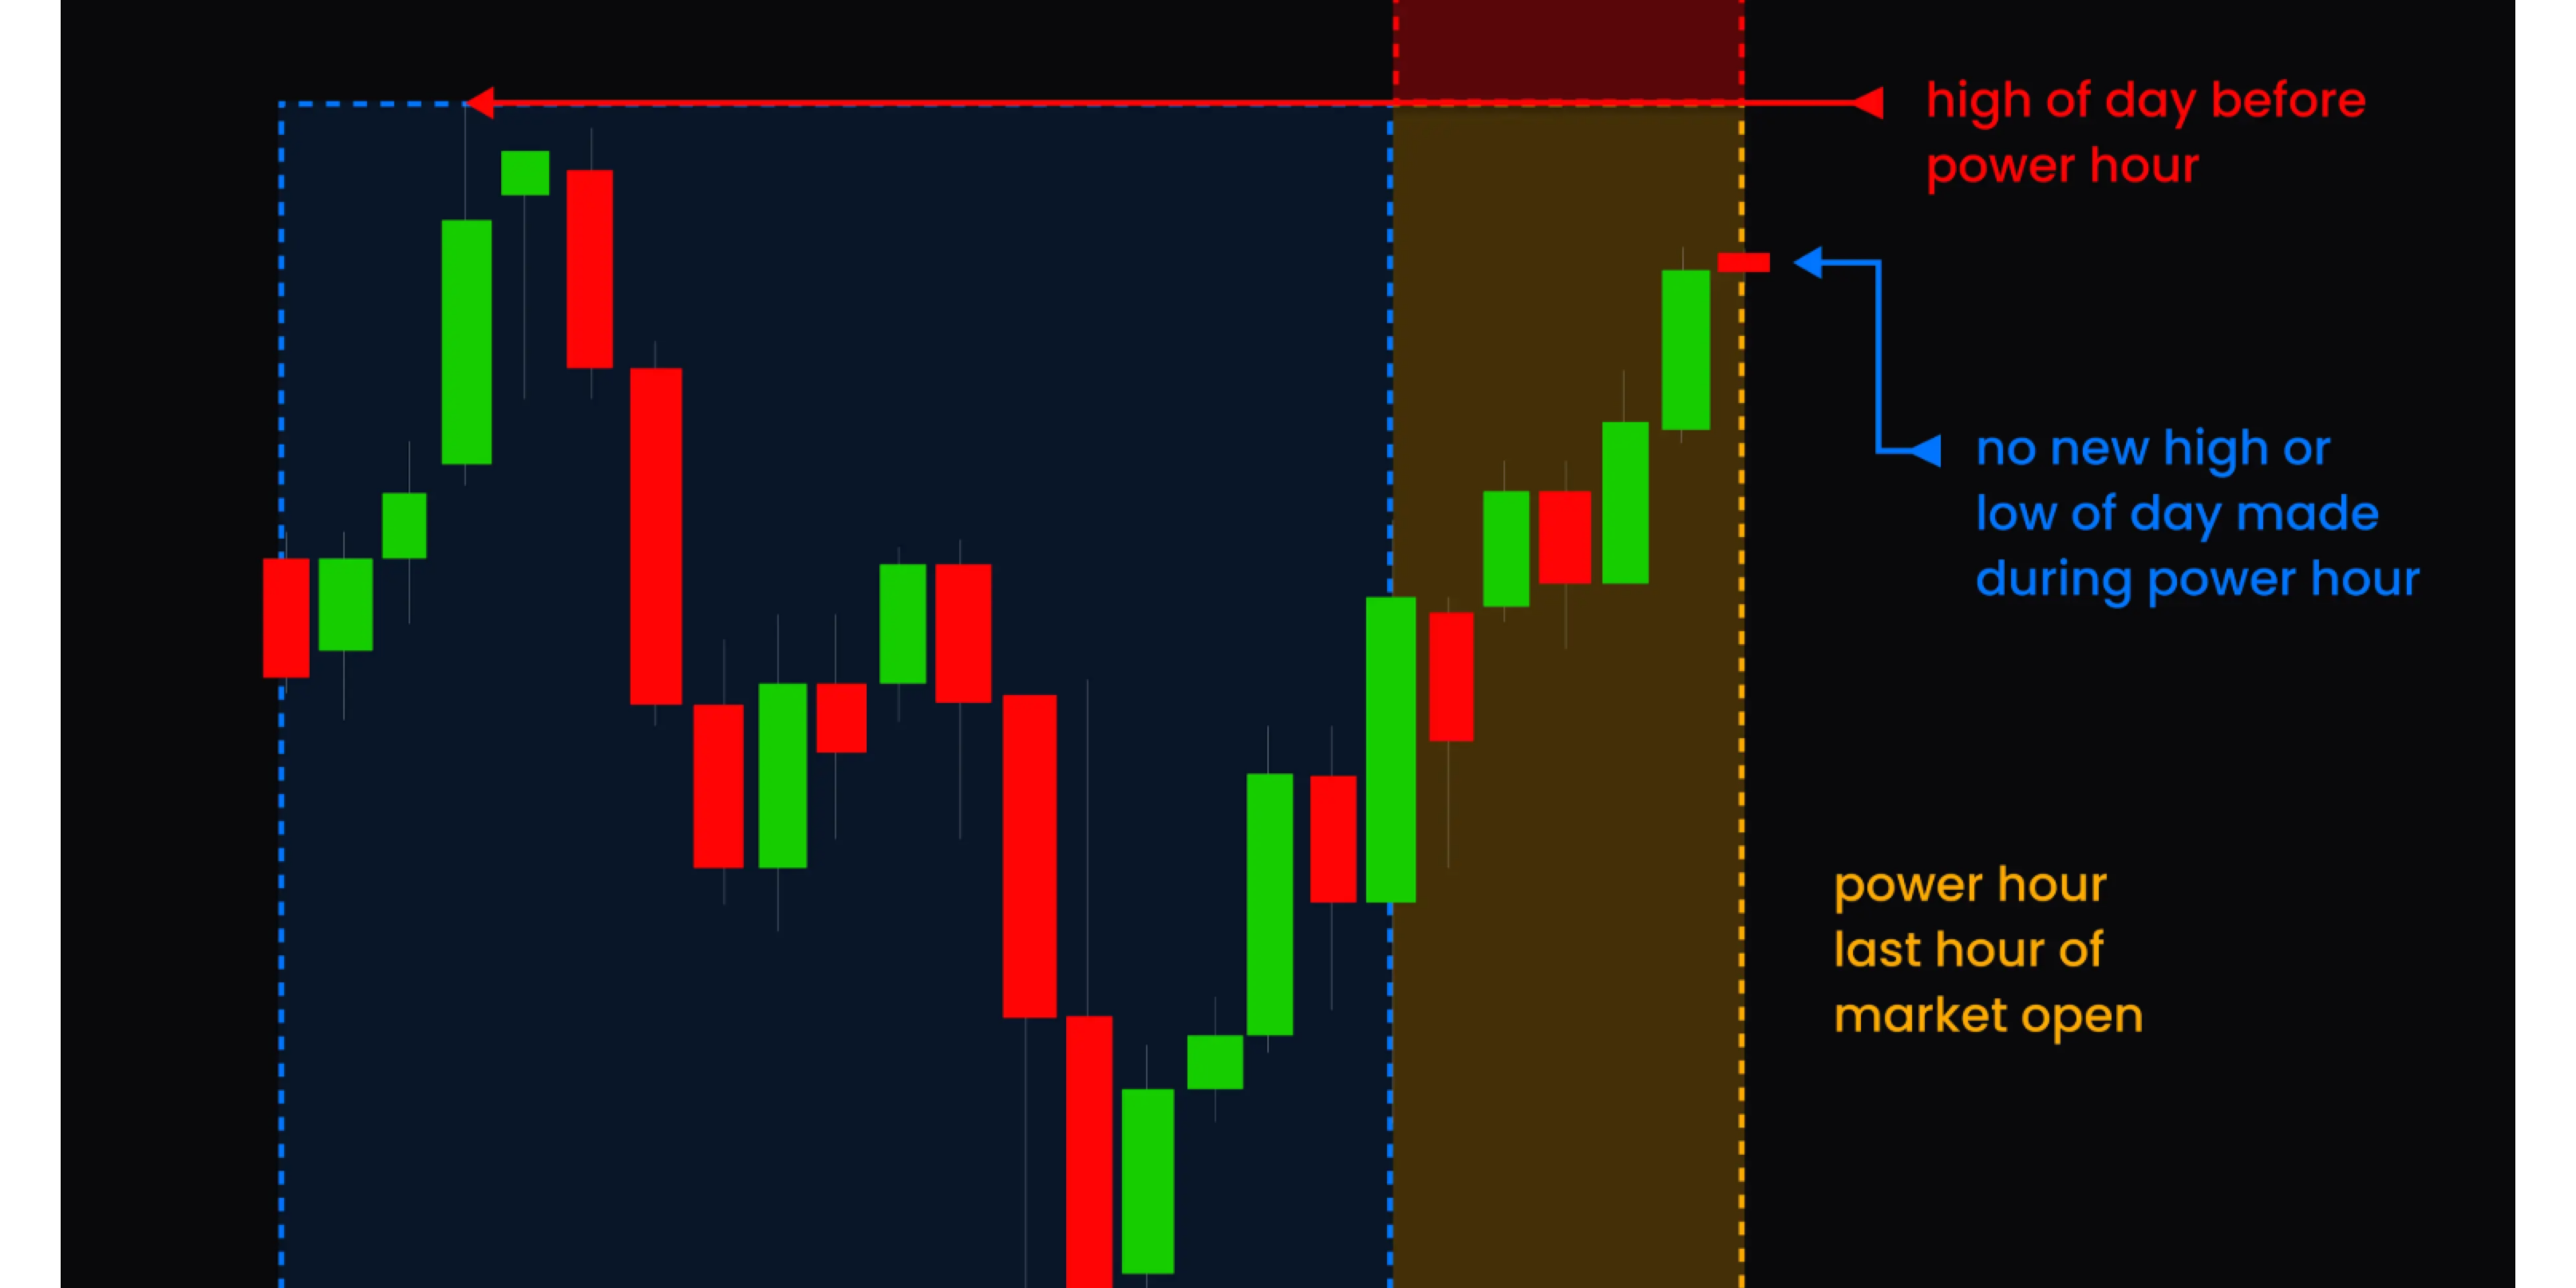
these statistics completely contradict the common belief that the last hour regularly produces new extremes. in fact, they show the opposite — power hour rarely results in new highs or lows of the day.
how to visualize power hour on your charts
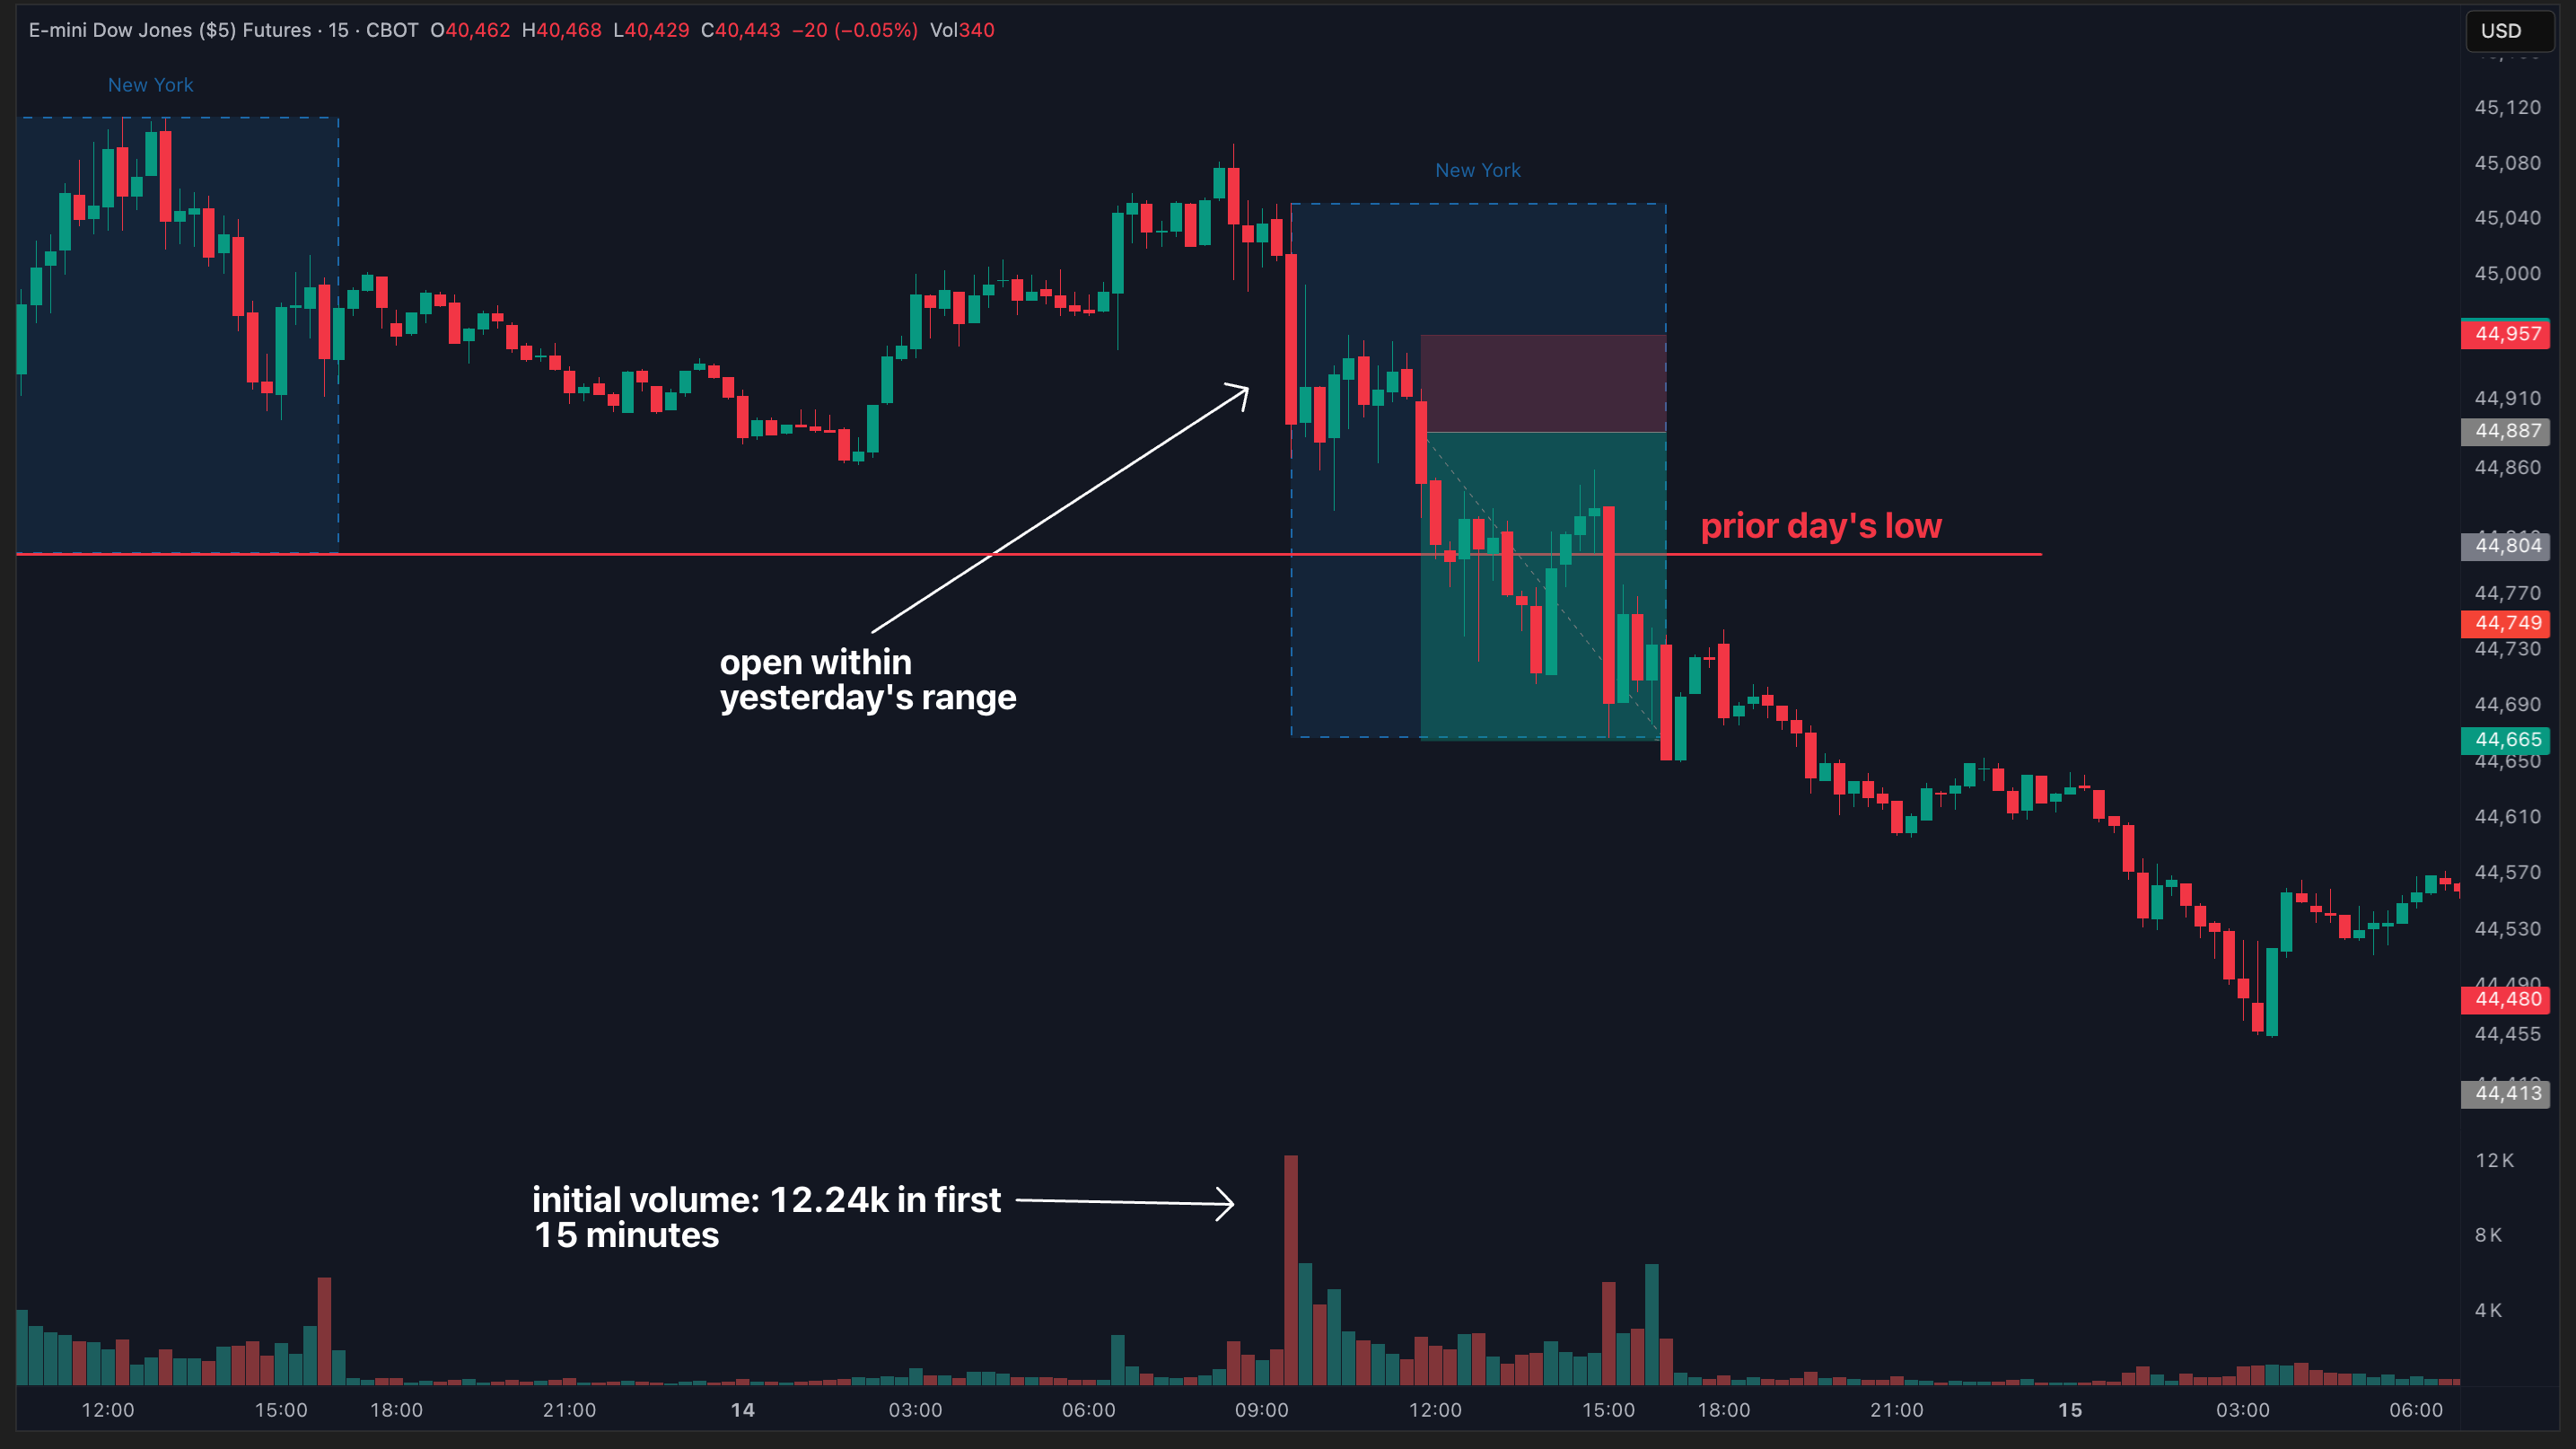
before we dive into practical applications, let's talk about how you can easily identify power hour on your charts using our power hour indicator on TradingView:

and by the way, you can get access to this indicator (as well as 30+ other TV indicators) for free with your edgeful subscription. all you have to do is type in your TradingView username after clicking the TV icon on the right sidebar of the edgeful dashboard.
the setup is simple:
- blue vertical lines highlight the power hour timeframe (3:00-4:00 PM ET)
- green horizontal line represents the previous day's NY session high
- red horizontal line shows the previous day's NY session low
- price action during power hour is clearly visible in relation to these key levels
now let's explore how to use this information to improve your trading.
scenario #1: setting proper targets throughout the day
if you know that price is unlikely to make a NHOD during the last hour (88% chance it won't on TSLA), and you're in a long position, there's absolutely no reason you should hold your trade "hoping" for the stock to make new highs in the final hour.
the same applies to short positions. if you know that price is unlikely to make a NLOD during the last hour, you shouldn't hold your shorts into the close expecting new lows.
instead, you should be focused on taking profits as price approaches the previous day's high or low.
real-world example: taking profits on tesla

in this example on TSLA, we see a bear flag breakdown right at the start of power hour. if you're short on this breakdown, the data tells you there's only a 14% chance price will make a new low of day.
rather than hoping for an unlikely scenario, you should:
- take partial profits as price moves in your favor
- consider full profit as price approaches the existing low of day
- recognize that further weakness right near the close is an excellent opportunity to exit
this approach aligns your expectations with statistical reality rather than wishful thinking.
scenario #2: preparing for reversals
what if the instrument you trade is approaching a NHOD or NLOD during power hour? we've already established that a breakout to new extremes is unlikely. this creates a potential trading opportunity: preparing for reversals.
trading reversals isn't easy, but with data on your side, you can significantly improve your odds. even if you "think" price is going to make a NHOD or NLOD, the statistics suggest you should be skeptical.
example #1: fading a test of the high

in this example on ES futures, we can see:
- price tested the day's highs right as power hour began
- the test was immediately rejected
- a significant selloff followed
knowing the low probability of a successful breakout to new highs, you could structure a short trade with stops above the high of day, giving you a favorable risk-to-reward ratio.
example #2: trading a failed breakout

this example shows a textbook bear trap:
- price breaks to new lows during power hour (rare)
- the breakout quickly fails
- price reclaims the previous low area
- a significant rally follows
understanding that new lows during power hour often fail, you could enter a long position when price reclaims the previous low, with a tight stop just below the new low of day.
using the power hour report to improve your trading
based on what we've covered, here are two key strategies to implement using the power hour breakout report:
strategy #1: profit-taking framework
- if you're in a profitable trade as power hour approaches, use the data to inform your exit strategy
- for long positions, recognize there's an 80-85% chance price won't make a new high during the final hour
- for short positions, understand there's an 80-85% chance price won't make a new low during the final hour
- take profits as price approaches existing daily extremes, rather than hoping for an unlikely breakout
strategy #2: reversal trading framework
- when price approaches daily extremes during power hour, look for signs of a potential reversal
- if price does break to a new extreme (which is rare), be especially alert for failed breakouts
- enter counter-trend positions when previous extremes are reclaimed after a failed breakout
- use tight stops just beyond the new extreme for a favorable risk-to-reward ratio
putting it all together: a data-driven approach to power hour
despite its name, the "power hour" rarely delivers on the promise of new highs or lows. instead of following what people usually say about it, use the power hour breakout report to:
- set realistic profit targets throughout the day, knowing that new extremes during the final hour are statistically unlikely
- identify potential reversal opportunities when price approaches daily extremes late in the session
- structure your trades based on actual data rather than hope or market myths
by understanding the true probabilities of the power hour and using data to guide your decisions, you can avoid the common pitfall of holding positions too long in hopes of an unlikely breakout. instead, you'll be positioned to take profits at appropriate levels and potentially capitalize on high-probability reversal setups.
the key takeaway
the next time someone tells you to hold your position into the close because "power hour is when the big moves happen," remember what the data actually shows. new highs and lows during the final hour are relatively rare events - occurring only 12-24% of the time across major instruments like TSLA, YM, and GC.
trade what's probable, not what's possible. use data to inform your decisions, not market myths or conventional wisdom.