overnight continuation trading strategy: how to use pre-market direction for 61% probabilities
what is an overnight continuation?
an overnight continuation refers to the tendency for the market to continue in the same direction as the overnight session (the period between the previous day's close and the current day's open).
for example, if you're trading the New York session (9:30AM to 4:00PM ET), the overnight session would be from 4:00PM of the previous day to 9:30AM of the current day. if the 9:30AM open is higher than the previous day's 4:00PM close, it's considered a green overnight session.
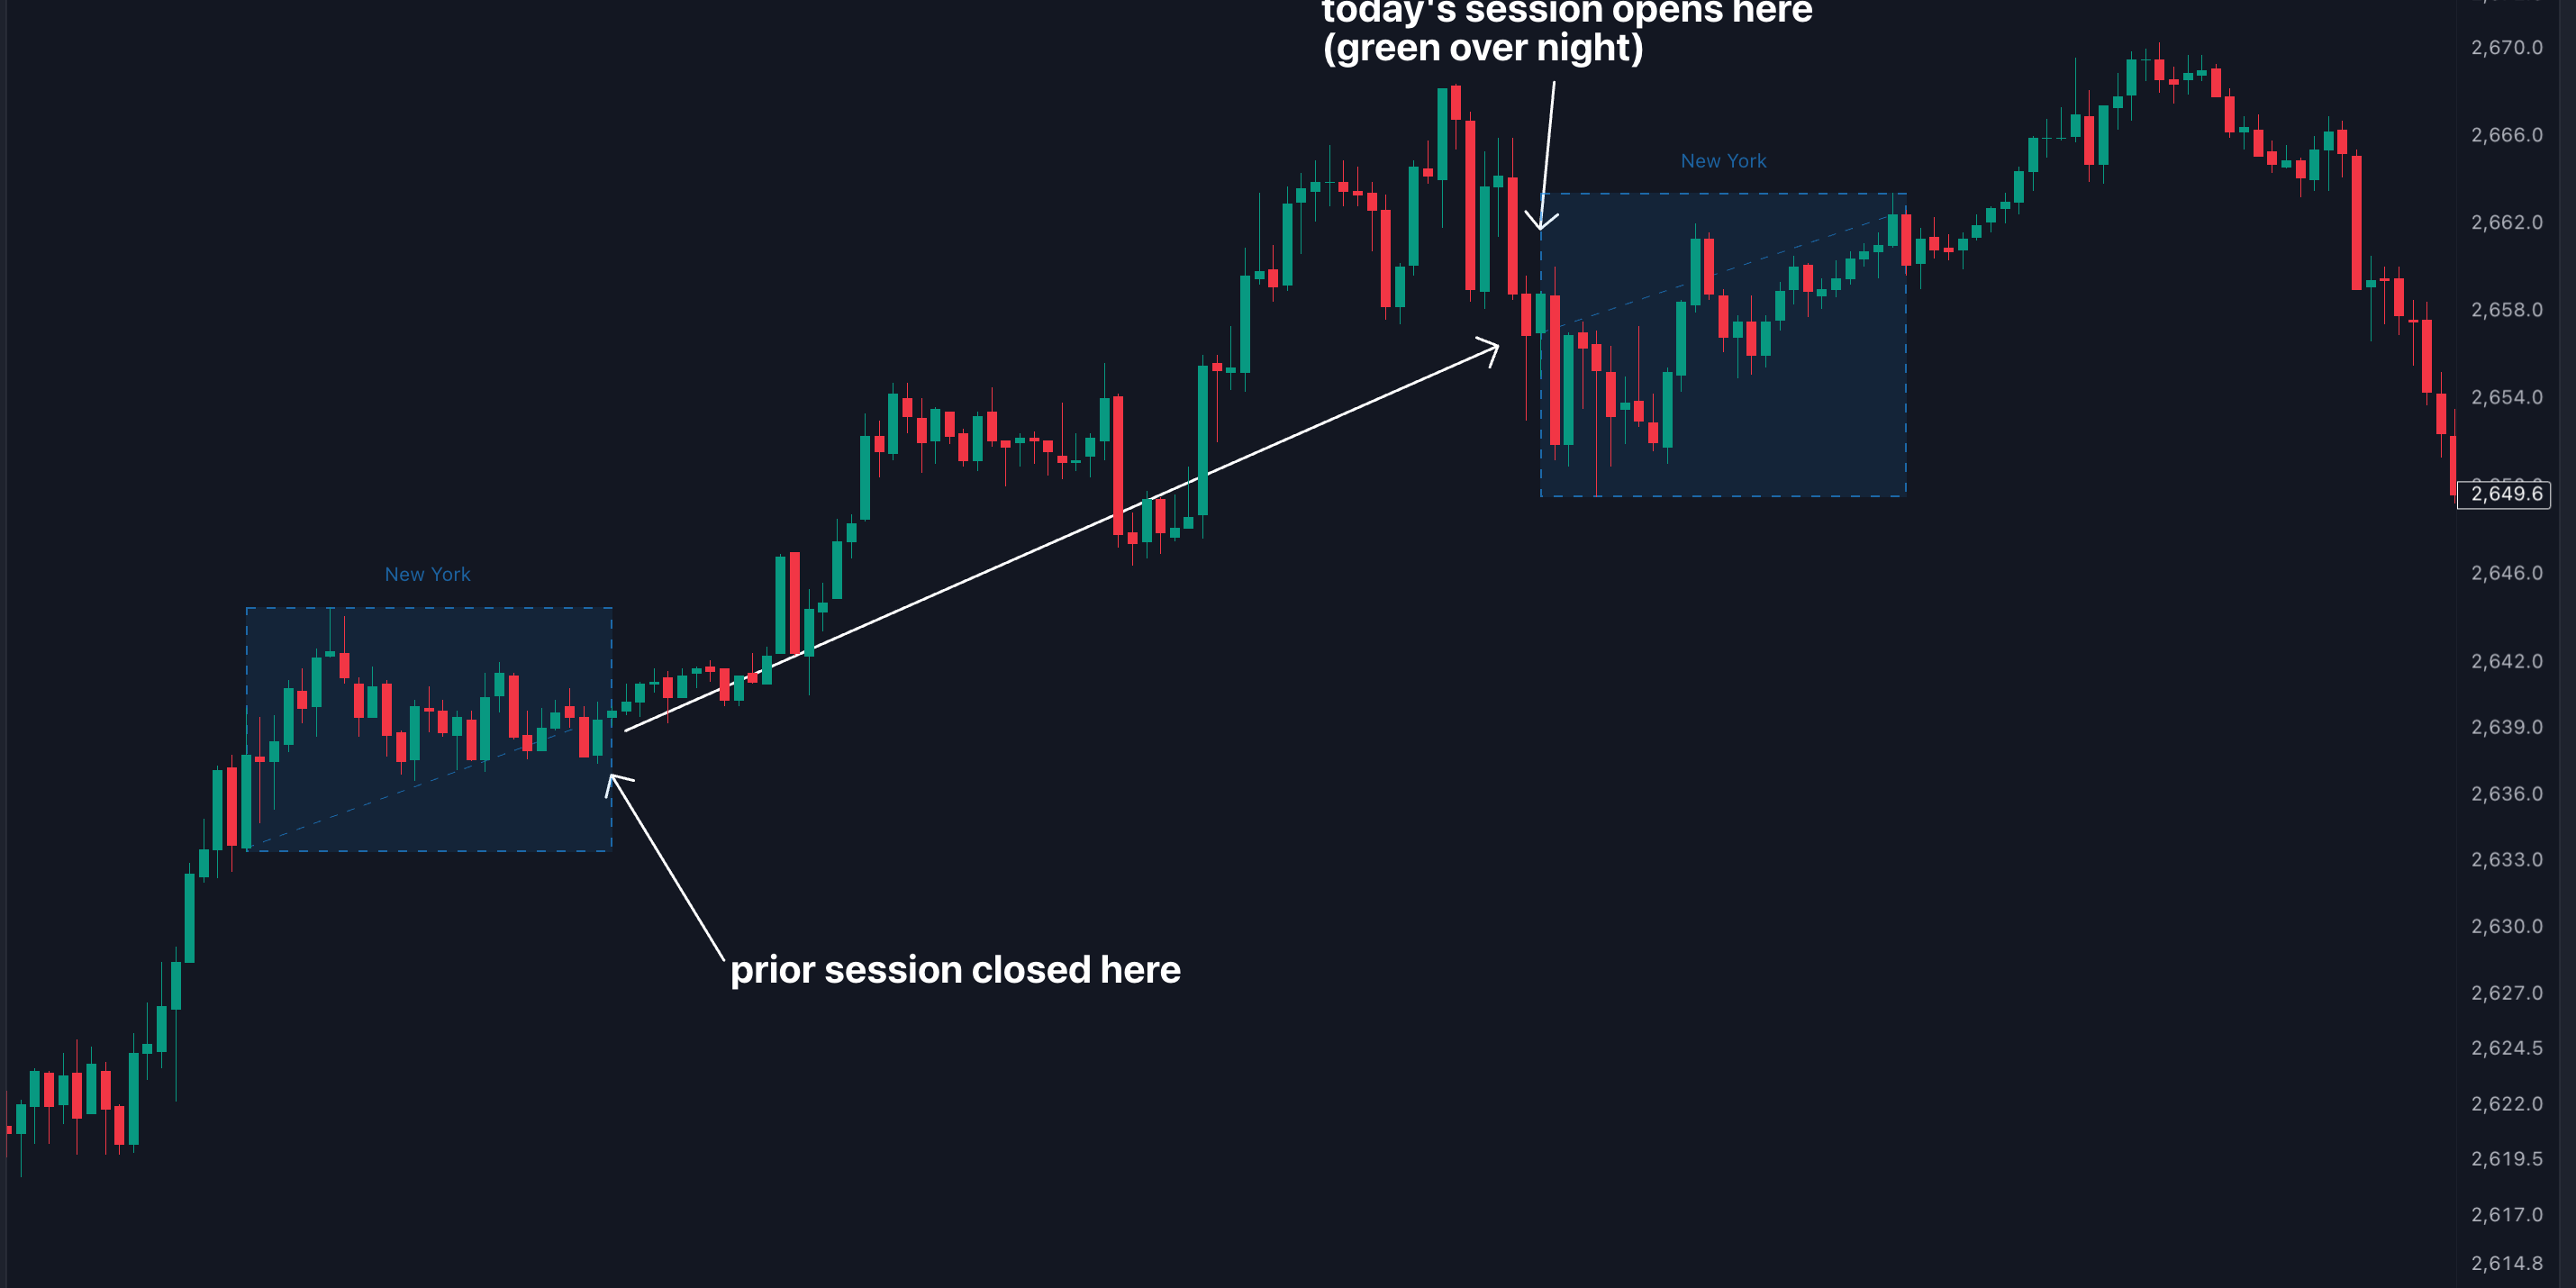
in the example below, we've made the New York session easily visualized with the blue boxes:

in this case, price moved up from the previous day's close to the current day's open, creating a green overnight session. the day then followed through to the upside, closing above the open.
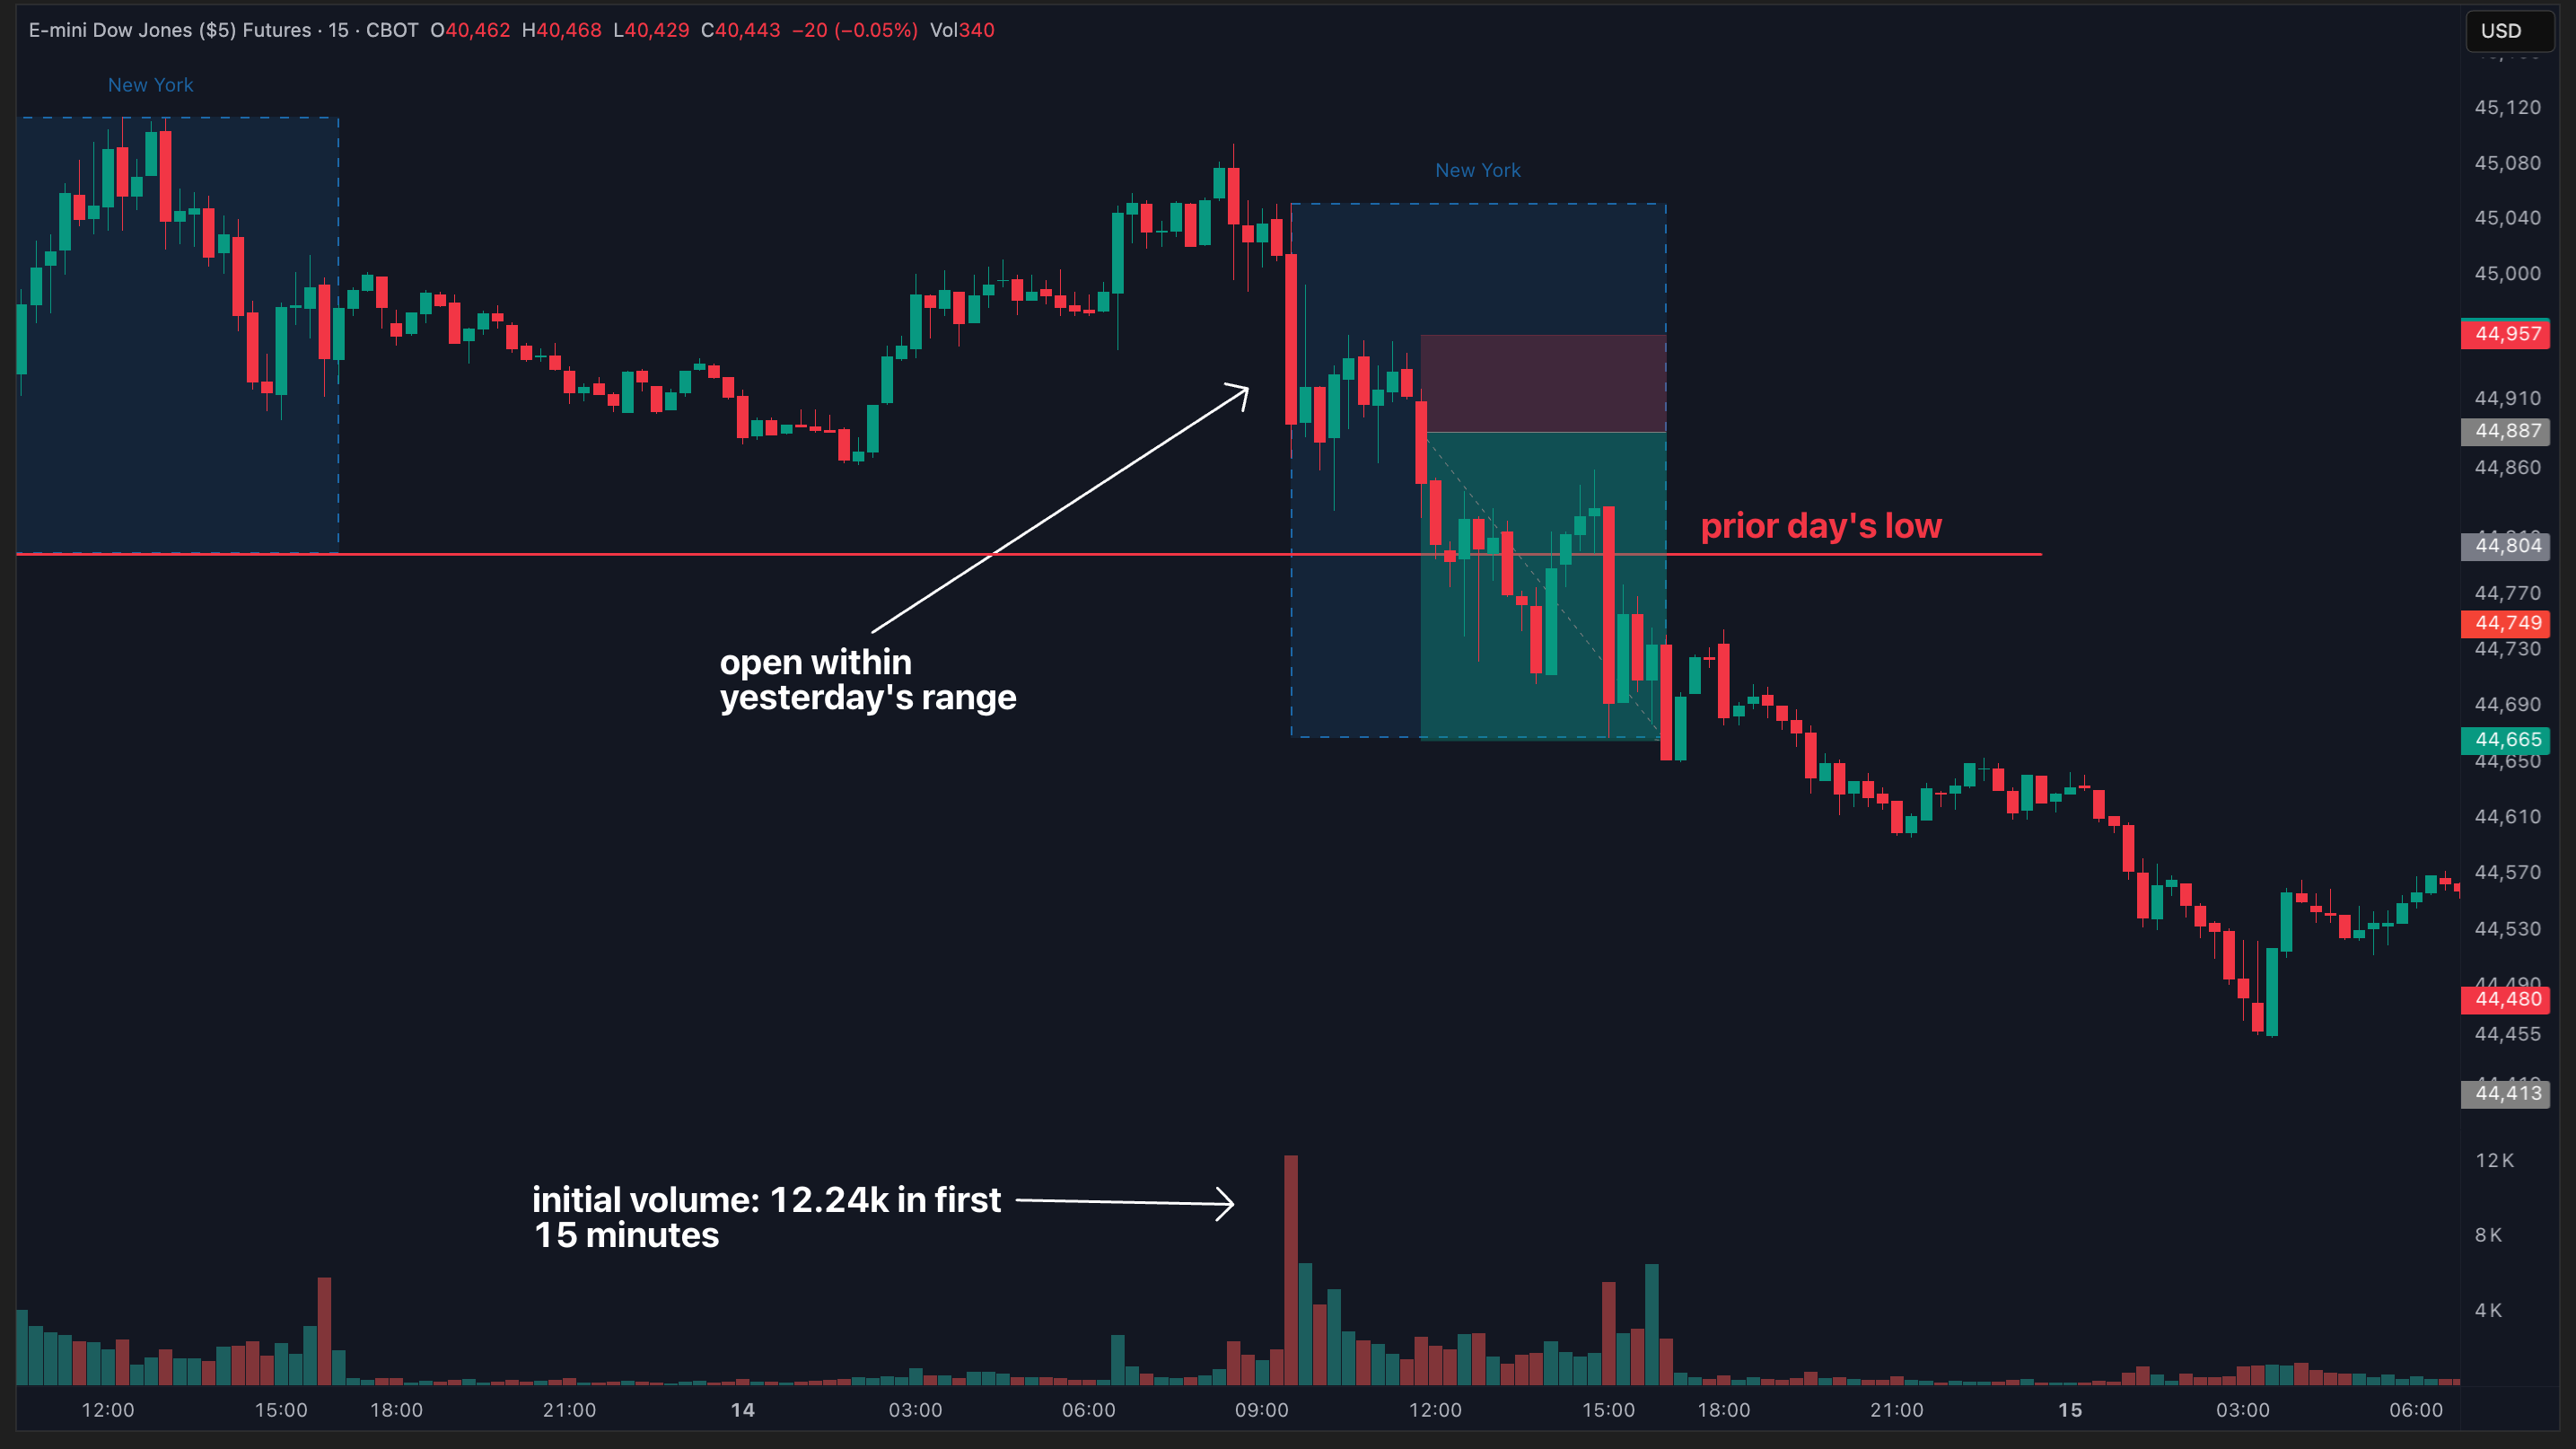
here's a look at downside continuation from a red overnight session:

what the data shows about overnight continuation
what we're really looking at is whether the overnight session direction has a predictive impact on the upcoming trading session.
if the overnight session is green — price moves up from the previous close to the current open — there may be a higher probability of the day closing green as well.
the same is possible for red overnight sessions leading to red daily closes.
let's look at what our data reveals for different instruments:
gold futures (GC) - 6-month stats

- over the last 6 months, a green overnight session has resulted in a green day 62% of the time
- over the last 6 months, a red overnight session has resulted in a red day 58% of the time
key takeaway: a green overnight is likely to continue to the upside during the trading session on GC, while a red overnight is also likely to continue to the downside.
S&P 500 futures (ES) - 6-month stats

- over the last 6 months, a green overnight session has resulted in a green day 47% of the time
- over the last 6 months, a red overnight session has resulted in a red day 38% of the time
key takeaway: on ES, a green overnight doesn't provide much of an edge either way. however, a red overnight actually signals a higher probability of a green day - making it a potential signal to look for 'buy the dip' opportunities.
the day of the week effect on overnight continuations
one crucial factor that many traders miss is how the day of the week impacts overnight continuation probabilities. our data shows dramatic differences depending on which day you're trading.
gold (GC) - Tuesday stats (from June to December of 2024)

- green overnight: 79% probability of a green close
- red overnight: 50% probability of a red close
these Tuesday stats are particularly strong and could form the basis of a high-probability trading approach.
gold (GC) - Wednesday stats (past 6 months)

- green overnight: 65% probability of a red day (reversal, not continuation)
- red overnight: 56% probability of a green day (reversal, not continuation)
notice how Wednesday's pattern actually reverses compared to Tuesday! this demonstrates why it's critical to analyze each day of the week separately rather than relying on general statistics.
building a real-time trading strategy
let's examine a real example from November 21st, 2024 (a Thursday) on gold futures (GC):

our data showed:
- green overnight session results in a green session 75% of the time on Thursdays
- double breaks (price breaking both the 15-min opening range high & low) occur 52% of the time on Thursdays
- gap ups (green overnight sessions) go unfilled 75% of the time on Thursdays
based on this data, we would expect:
- price to close green on the session (above the open)
- a double break setup if trading the opening range breakout (ORB)
- the gap to remain unfilled throughout the session
and that's exactly what happened.
- green overnight session occurred
- price gapped up, then undercut the 15-min opening range (setting up for a potential double break to the upside)
- entering near the OR low with targets at the OR high (anticipating the double break) resulted in nearly a 2R trade
this example demonstrates how to stack multiple edges to build a data-backed trading plan.
how to apply overnight continuations to your trading
follow this 5-step process to incorporate overnight continuation into your trading approach:
- check the overnight session color before the market opens
- review the probability of continuation for your specific instrument
- bias your trades in the direction supported by the statistics (this varies significantly by instrument!)
- look for intraday setups that align with your bias, using complementary strategies like opening range breakouts, gaps, or outside days
- manage risk carefully with appropriate stop losses - even high-probability setups aren't guarantees
advanced techniques for overnight continuation trading
once you've mastered the basics, consider these advanced techniques:
- filter by weekday to identify which days have the highest probability of continuation
- use market session indicators to visualize overnight moves and key levels
- study counter-trend days to understand when the pattern may not hold
the edge of data-driven trading
overnight continuation analysis provides a powerful tool for biasing your intraday trades and aligning with larger momentum patterns. by combining visual analysis of overnight moves with hard data, you can:
- build a trading plan based on statistical probabilities rather than emotions
- avoid making decisions based on feelings or hunches
- stack multiple high-probability patterns to create a robust trading system
remember, the key to successful trading isn't finding a perfect strategy that works 100% of the time. it's about identifying and exploiting statistical edges consistently over time.
using the overnight continuation to build a bias
what we want to make clear to you is this: just because the overnight session may be green, it isn’t a signal to blindly buy in that direction. this report will help you align your bias with data, and then it’s up to you to find proper entries with great risk:reward.
we’ve covered some other great reports to pair with this one:
- opening range breakouts (ORB)
- gaps (either fills or continuations)
- outside days (either bearish or bullish)
wrapping up
the overnight continuation pattern exemplifies why data-driven trading is superior to emotional decision-making. when you know that certain patterns have a 60%, 70%, or even 79% probability of playing out in a specific way, you can trade with greater confidence and precision.
by combining overnight continuation analysis with other high-probability setups like outside days, opening range breakouts, and gap fill trades, you can develop a comprehensive trading approach that consistently puts the odds in your favor.
want to access our comprehensive data on overnight continuations and dozens of other high-probability trading patterns? start your free 7-day trial of edgeful today.