the opening candle continuation strategy: how the first 60 minutes can predict the trading day

what is the opening candle continuation strategy?
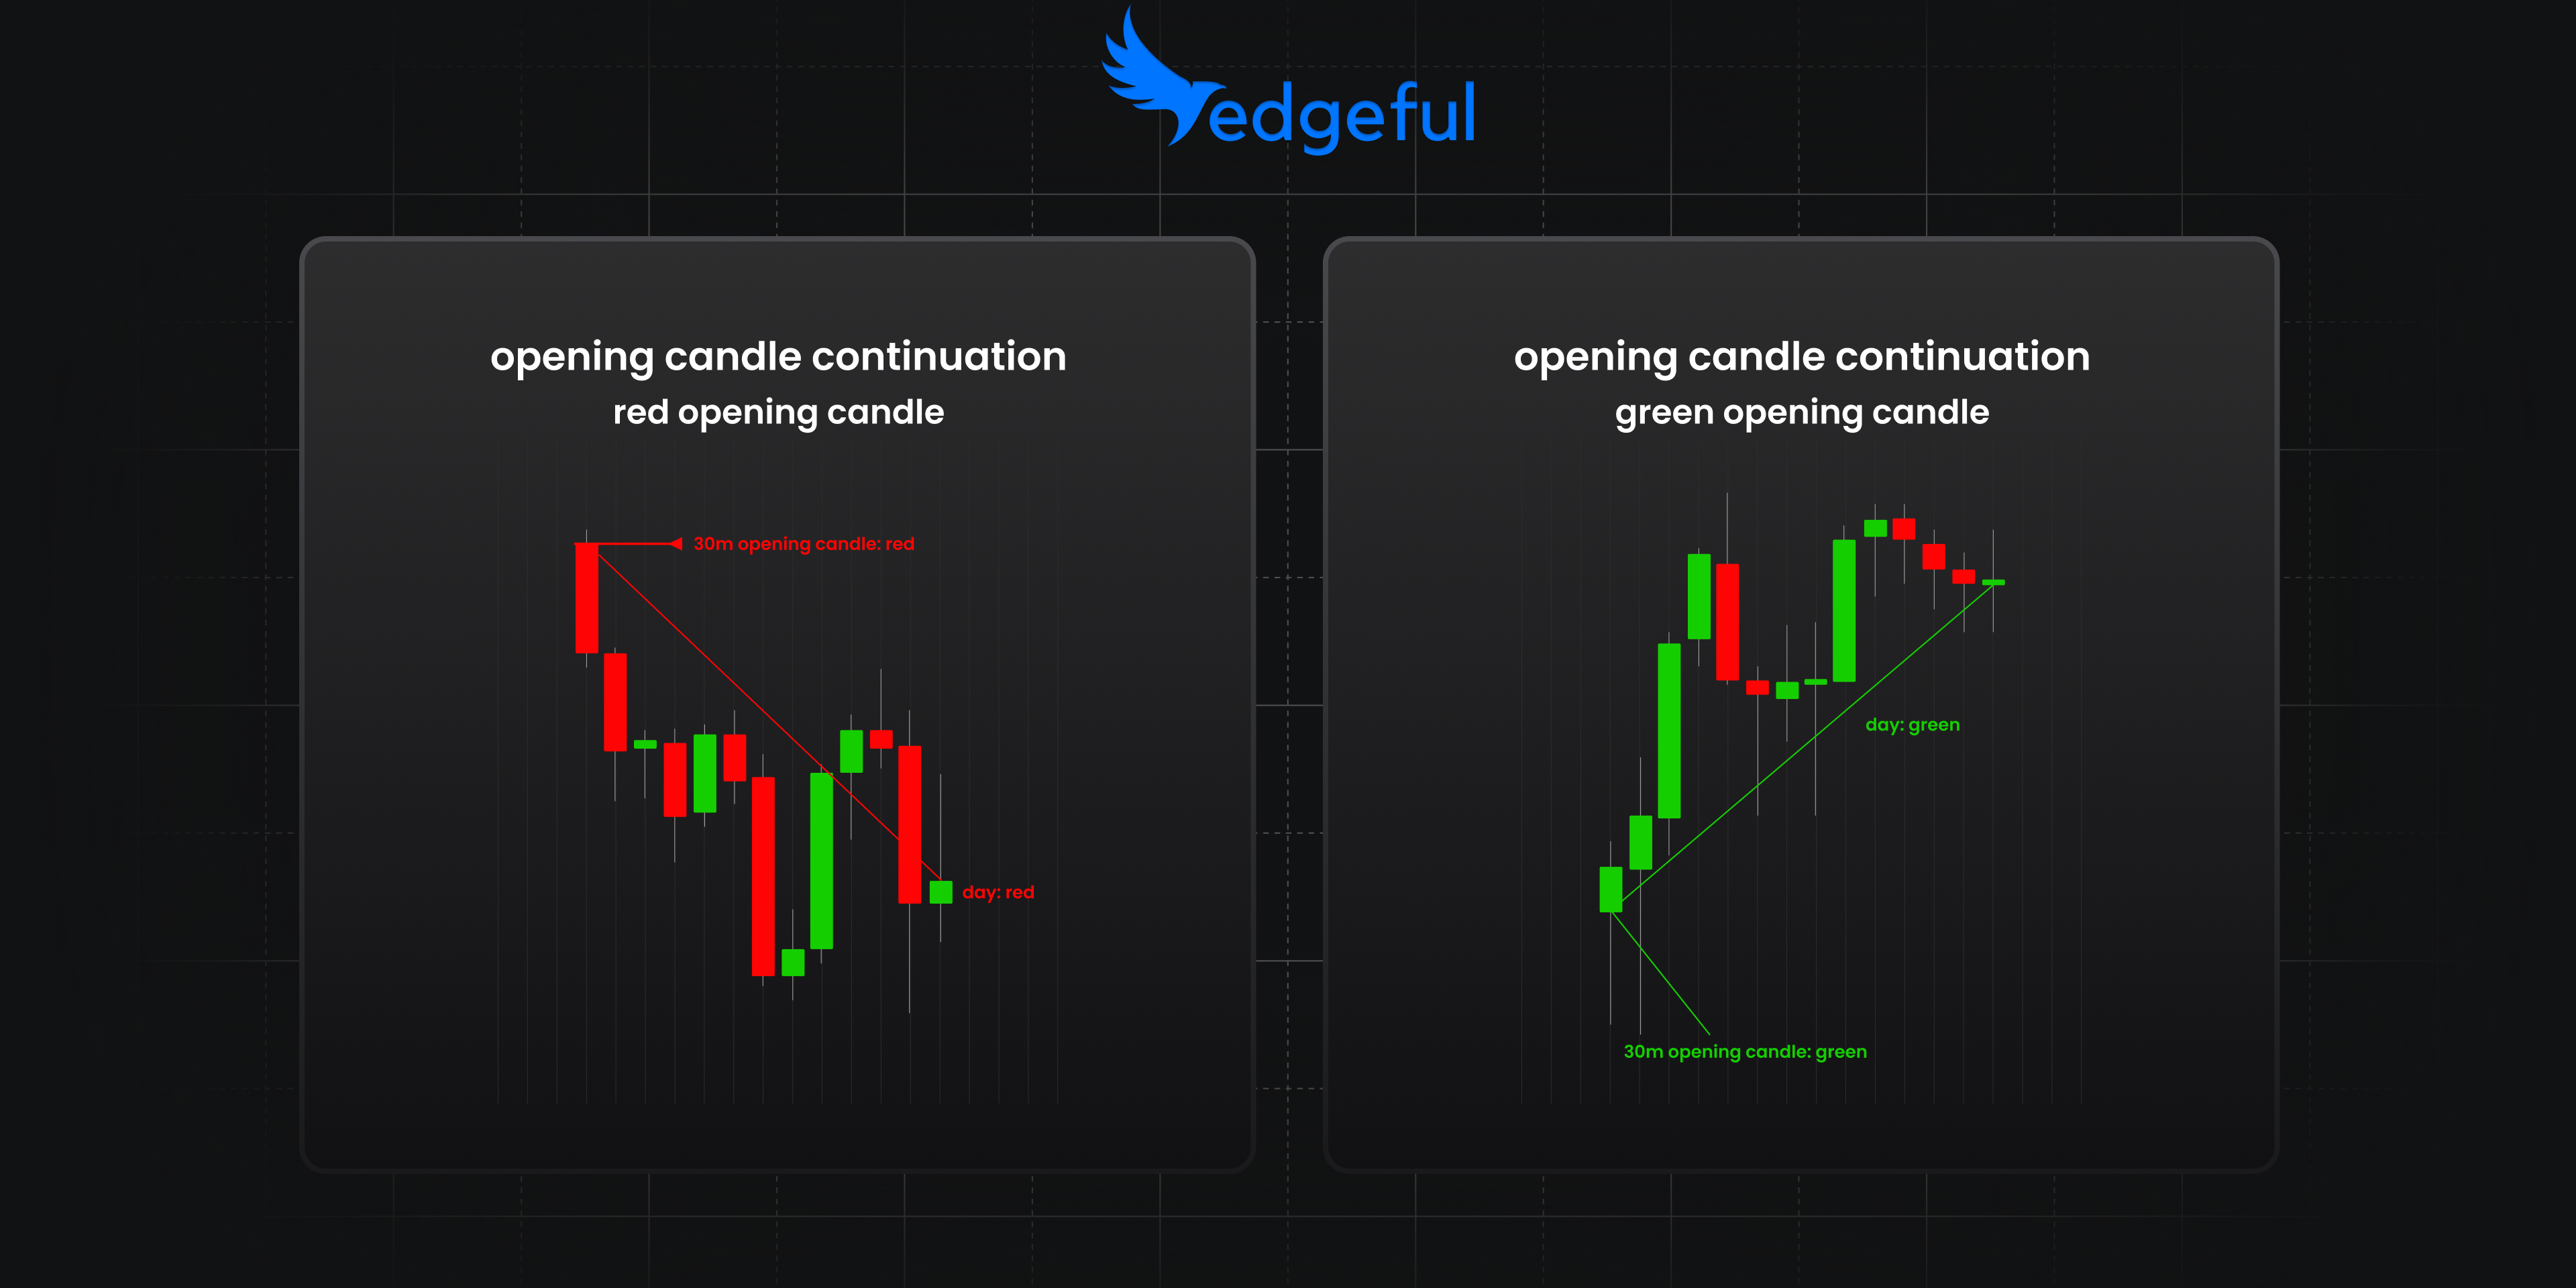
the opening candle continuation is a pattern where the color (green or red) of the first 5min, 15min, 30min or any other timeframe candle of the session predicts the direction of the entire trading day.

at edgeful, we recommend you look at the first 60 minutes of your trading session and use this as the opening candle.
why the opening candle matters for your intraday trades
if the instrument you’re trading has closed green on the session 65% of the time when the opening candle is green, wouldn’t you want to make sure your trading for the session is aligned with this trend?
the same can be said for the downside—if the instrument you’re trading closes red 60% of the time when the first 30-minute candle is red, wouldn’t you want to be aligned with this trend?
we’re going to show you exactly how to find this data & apply it using our “opening candle continuation” report in edgeful.
how to use the opening candle continuation strategy with edgeful's reports
here are all of the opening candle continuation strategy stats we will be analyzing:
- market: futures
- ticker: NQ
- timeframe: 60-minute opening candle
- session: New York (candles start at 9:30 AM ET)
- date range: past 6-months

- as you can see, when the NQ’s first 60-minute candle is green, it will close the day green 80% of the time!
- on the other side, when the first 60-minute candle on NQ is red, we’ll close the session red 71% of the time.
here's the clear takeaway: the color of the first 60 minutes sets the tone for the rest of the session — your bias must match the direction of the opening candle!
weekday patterns in the opening candle continuation strategy
but we can take this a step further by breaking down the data by day of the week. turns out, certain days have an even stronger edge:

we’ve selected ‘Friday’ as our day filter above, and you can see that a green first 60min candle on NQ results in a green day 85% of the time.
a red first 60min candle results in a red close 66% of the time… let’s now compare this data with Wednesday’s:

a green first 60min candle on a Wednesday results in a green close 88% of the time… there are no sure signals in the market, but this is as close to it as it gets.
you can also see a red first 60min candle results in a red day nearly 90% of the time...
we’ll let you go through the data for the rest of the sessions on your own, but you’re now equipped with knowledge that a lot of traders don’t have.
watch the first 60-minute candle, know what’s likely to happened based on prior data, and develop your directional bias accordingly!
click here to study the opening candle continuation report.
bringing it all together
here's how you can start using opening candle continuations in your trading:
- check the color of NQ's first 60-minute candle
- if green, lean bullish and look for long opportunities (more so on some weekdays than others)
- if red, lean bearish and look for short opportunities (more so on some weekdays than others)
of course, no pattern works 100% of the time, so always manage your risk and have a plan for when the trade doesn't go your way.
wrapping up: how to apply the opening candle continuation strategy daily
we covered a lot today, so let's recap:
- what opening candle continuations are & why they matter
- using edgeful's data to identify high-probability setups
- breaking down the edge by day of the week
- incorporating the pattern into your trading plan
- combining other reports to build a bullet-proof edge
if you’re not an edgeful subscriber and are looking to start trading based on data, not your emotions, take advantage of our 7-day free trial by clicking on the big blue button on the top right of your screen.
we’re considering removing our free trial completely, so act now…


