crush emotional trading: 3 powerful reports to trade market session breakouts

why most traders struggle with consistency
I’ve had 1:1 conversations with thousands of traders, and one of the main problems I see is this:
the majority of traders enter their trades with a bias that’s based on gut feel or emotion, rather than on data. there’s nothing to back their opinion — which means there’s zero confidence to hold through a normal drawdown, stopping out early on normal price action — or they’re way too quick to take profits using completely random levels, and end up leaving tons of money on the table.
this is where the market session breakout report comes in.
in this stay sharp, i’m going to walk you through the market session breakout report and how to use it — in addition to two other reports — to help you build a bias based on data, not your emotions, as well as give you repeatable profit targets that you can rely on every single day.
here's exactly what we're going to cover:
- what is the market session breakout report & how it helps you build data-backed profit targets
- how to use two other reports — the initial balance and the opening candle continuation — to set a bias and know what areas to target
- a walkthrough of these 3 reports, focusing on YM during the NY session, and how to use the reports to build a strategy
this will take no more than 10 minutes of your time and will have a huge impact on your trading, so stay with me:
step 1: what is the market session breakout report?
the market session breakout report measures how often one trading session breaks out of another session's range. today, we're looking at how often the NY session breaks the London session's range.
more specifically — we are going to be focused on what the NY session does after the London session closes at 11:00am ET. you’ll see why this is important in a second.
the chart below is YM from February 21st, 2025 and is the example I’ll be using for the rest of this stay sharp walkthrough. the green box is the London session, and the blue box is the NY session. you can easily see the open, high, low, and close of both the NY and London sessions:

i’m using the “edgeful - market sessions” TradingView indicator to automatically plot the open, high, low, and close of both the London and NY session. to get access to this indicator, click the TradingView logo on the right sidebar of the Edgeful app, and put in your TradingView username in the pop up.
why the relationship between the NY and London sessions matters
if you're a futures, forex, or crypto trader during the NY session, you can use the London high or low as potential profit targets for your trades. more importantly, these targets are repeatable and you can rely on them every single session, rather than taking profits too early or too late using arbitrary R multiples.
so what does the market session breakout report tell us?
using the market session breakout report, we’ll know how often:
- the NY session breaks either the London high or low (single break)
- the NY session breaks both the London high and low (double break)
- the NY session stays completely inside the London high and low (no break)
and to be clear — the market session breakout report is only looking for single, double, or no breaks after the London session closes at 11:00AM. it does not consider the NY session action between 9:30 am and 11:00AM because the London session is still open and can make new highs or lows during this period. so, you have to wait until 11:00 am for the London session to close before looking for a trade.
visual examples of single, double, and no breaks
here's a visual example of a single break:

in this example, the NY session only broke through one side of the London range — the London low.
here’s an example of a double break, where the NY session first breaks below the London low, and then goes on to break above the London high — all between 11:00 am and 4:00PM ET:

here’s what a no break looks like:

reminder: breaks during the NY session can only occur after the London session closes at 11:00AM ET.
so when looking between 11:00 and 4:00 ET on the chart above, you’ll see that the NY session stayed completely within the London session’s high and low — making it a no break day.
step 2: the market session breakout report stats on YM
now that you know what the market session breakout report tells you, as well as what a single, double, and no break is, I'm going to show you an example of how to apply the report using YM (dow futures).
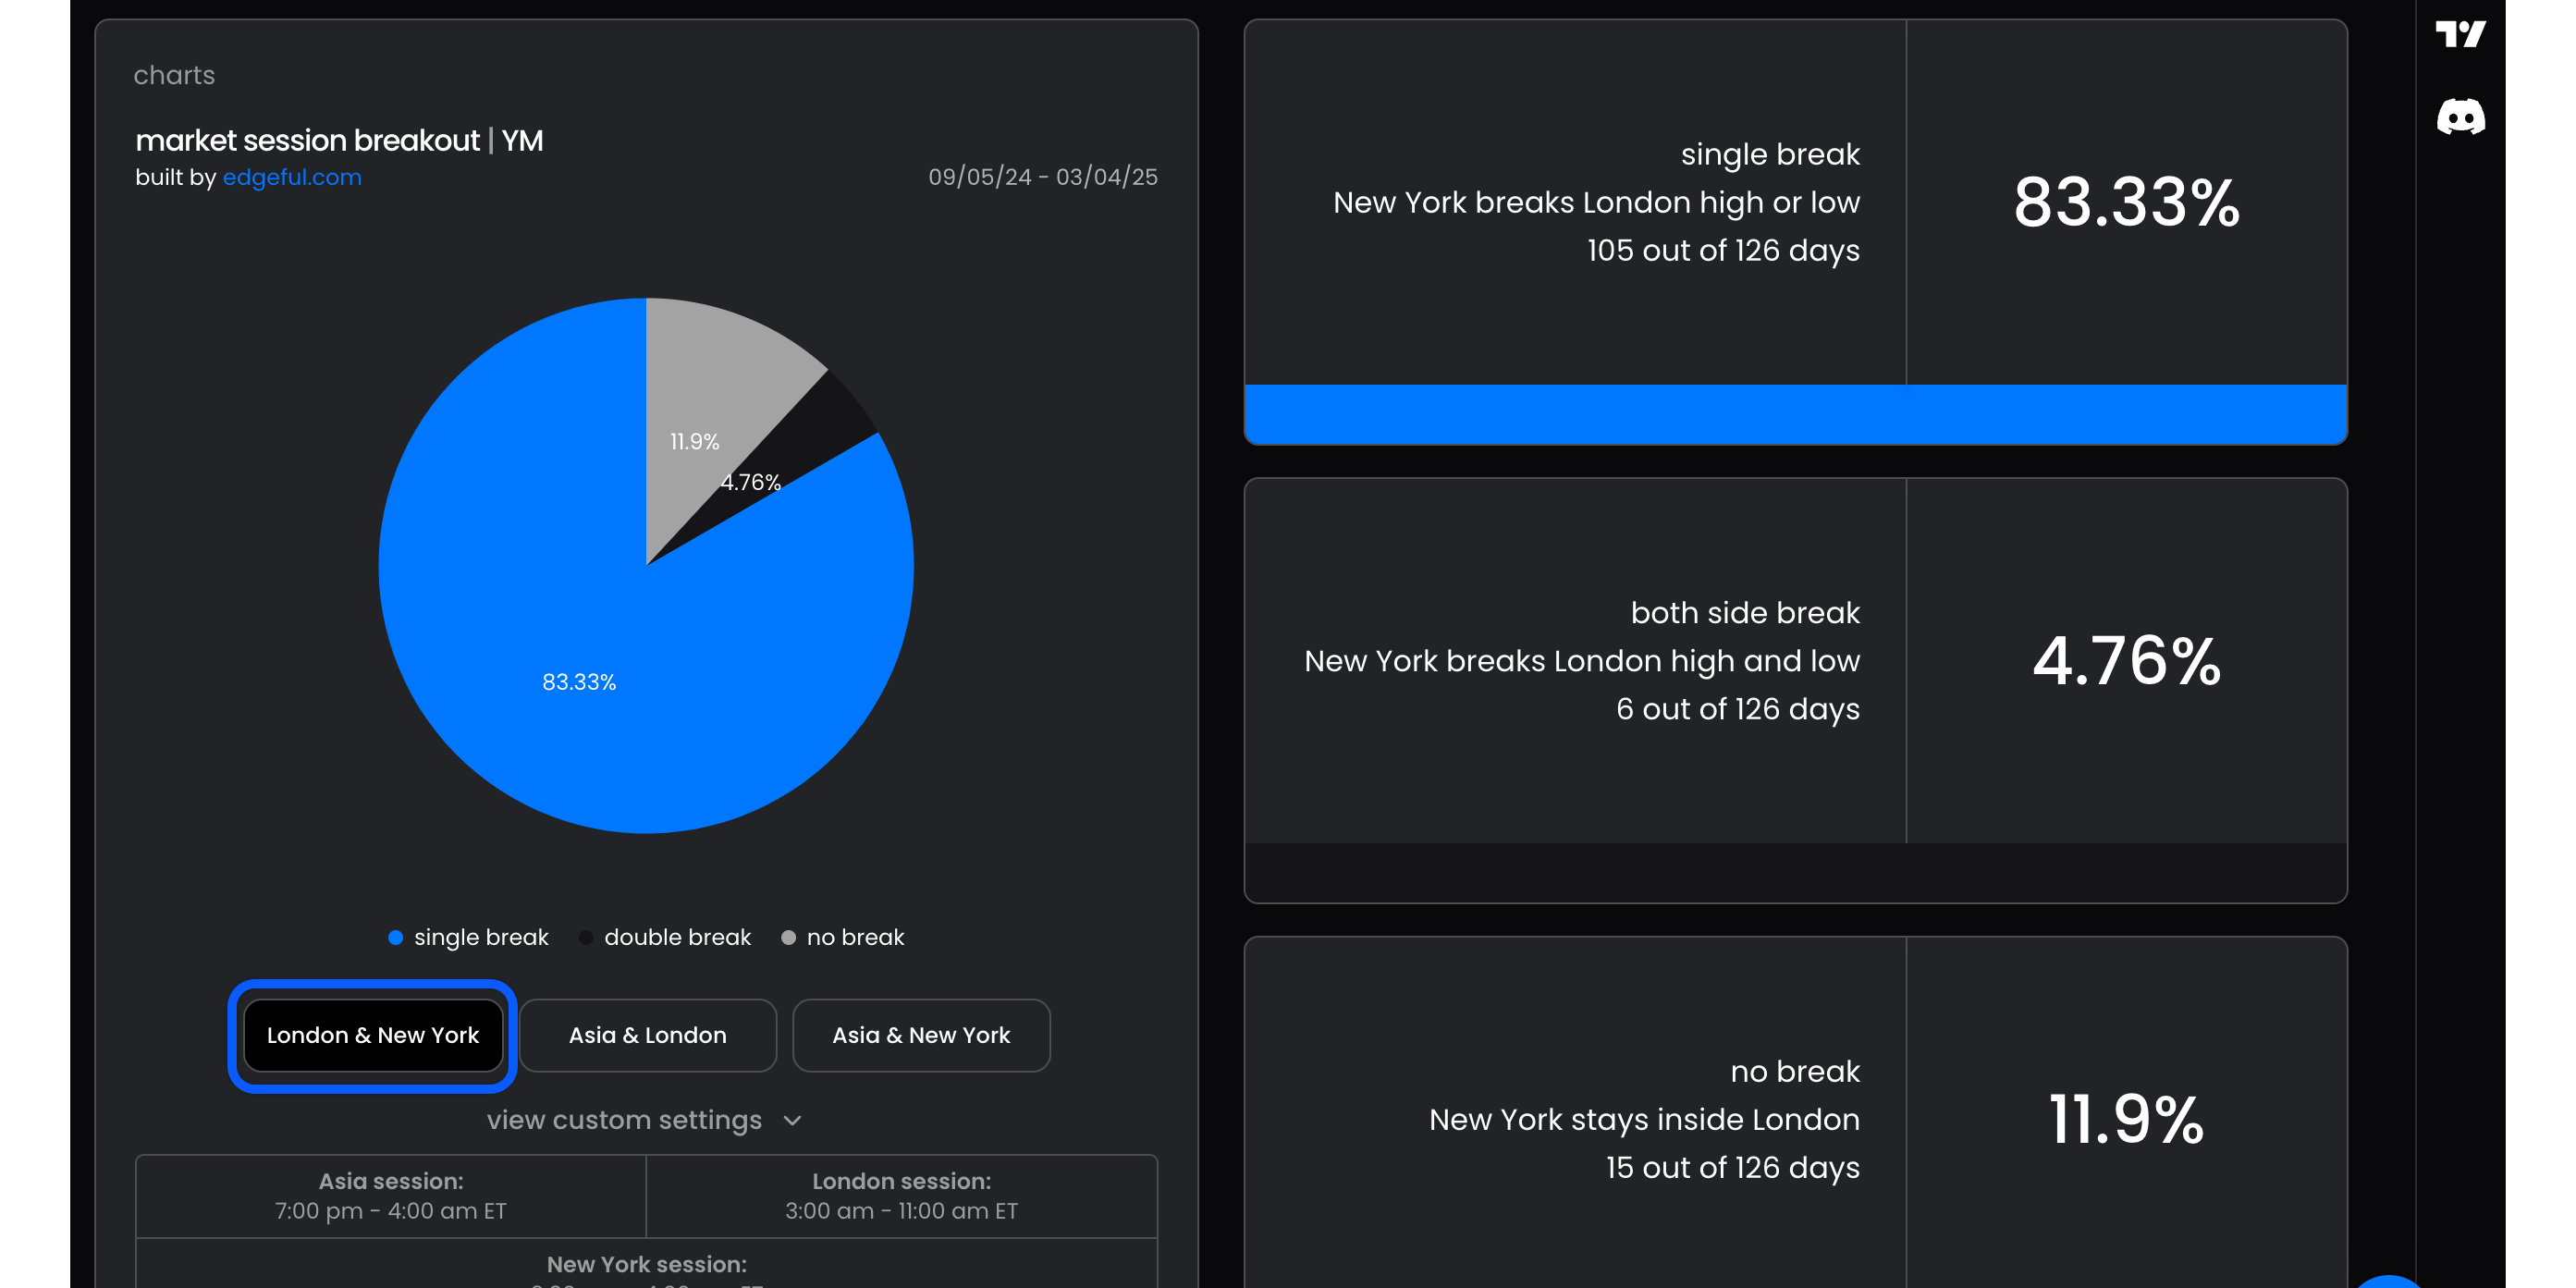
let's take a look at the current market session breakout stats for YM:

- single break: 83.2% of the time, NY breaks either London's high or low
- double break: 4.8% of the time, NY breaks both London's high and low
- no break: 12% of the time, NY stays within the London range
the data shows that 83.2% of the time in the last 6 months, the NY session has only broken out of one side of the London session’s range. this means that after the London session closes at 11:00 am et, you can confidently target either the London high or low, because price typically only breaks one side.
with this in mind, let’s check back on our example from February 21st on YM:

you can see that by midday, YM has not broken out of the London range yet. remember that based on the stats, it’s very likely that YM does break one side of the London range — the single break happens 83.2% of the time over the last 6 months.
this means you should still be expecting one side of the range to break, even if it hasn’t yet. but how do you choose which side to target?
this is where the OCC and IB reports come in:
step 3: use these OCC and IB reports to set data-backed targets
by the time the London session closes, at 11:00 am et, we also have data from two other key reports:
opening candle continuation (OCC)
the OCC report checks: if the first hour of the NY session is green vs red, how often does the NY session close green or red.
the OCC report is one that i highly recommend pairing with the market session breakout report because of how simple it is to understand — and more importantly, how effectively the data can be used to set your bias for the session. you’ll see what i mean in a second.
here’s the data on the OCC for YM in the last 6 months:

- a red first hour of the NY session, from 9:30 am to 10:30 am, resulted in a red day 66.23% of the time.
so, if the first hour is red, it’s very likely that the session will be bearish overall.
with this in mind, let’s look at the example from February 21st:

you can see that the first hour of the NY session closed red. based on the OCC stats we just covered, this immediately tells us our bias for the rest of the NY session should be bearish.
initial balance breakout (IB)
the IB report tracks how often one side of the initial balance (first hour’s high-low range) is broken (single break), both sides (double break), or neither side (no break).
IB stats on YM over the last 6 months:

- single break: 76%
- double break: 20%
- no break: 4%
a single break — where price breaks above one side of the IB range — is very likely. so you want to target a break of one side, just not both sides of the IB on any day.
with this in mind, let’s check back with our example from February 21st:

you can see that by the time the london session closes at 11:00 am et, YM has not broken either side of the IB range. it’s very unlikely that price stays within the IB range by close — this only happens 4% of the time — so you should be expecting one side of the IB range to break by the end of the NY session.
you can use the OCC report to easily identify which side of the IB range is likely to break. a red OCC means you can expect bearish momentum to continue, which makes a break of the IB low likely, and we can use this level as another high-probability target.
step 4: using the stats to build a trading plan
here's how you can use the market session breakout report, as well as the OCC and IB report to build a trading plan, step by step:
- wait for the London session to close (11:00 AM ET)
- check where price is relative to the London range
- use the OCC report to build a bias (if OCC is red, your bias for the NY session can be bearish. if OCC is green, your bias for the NY session can be bullish)
- use the IB report to see if price has broken the IB high or low (a single break occurs 76% of the time on YM and a no break only happens 4% of the time so you can expect one side to break, just not both sides)
- set your profit targets at the London high or low, depending on the bias you’ve built based on the OCC and IB
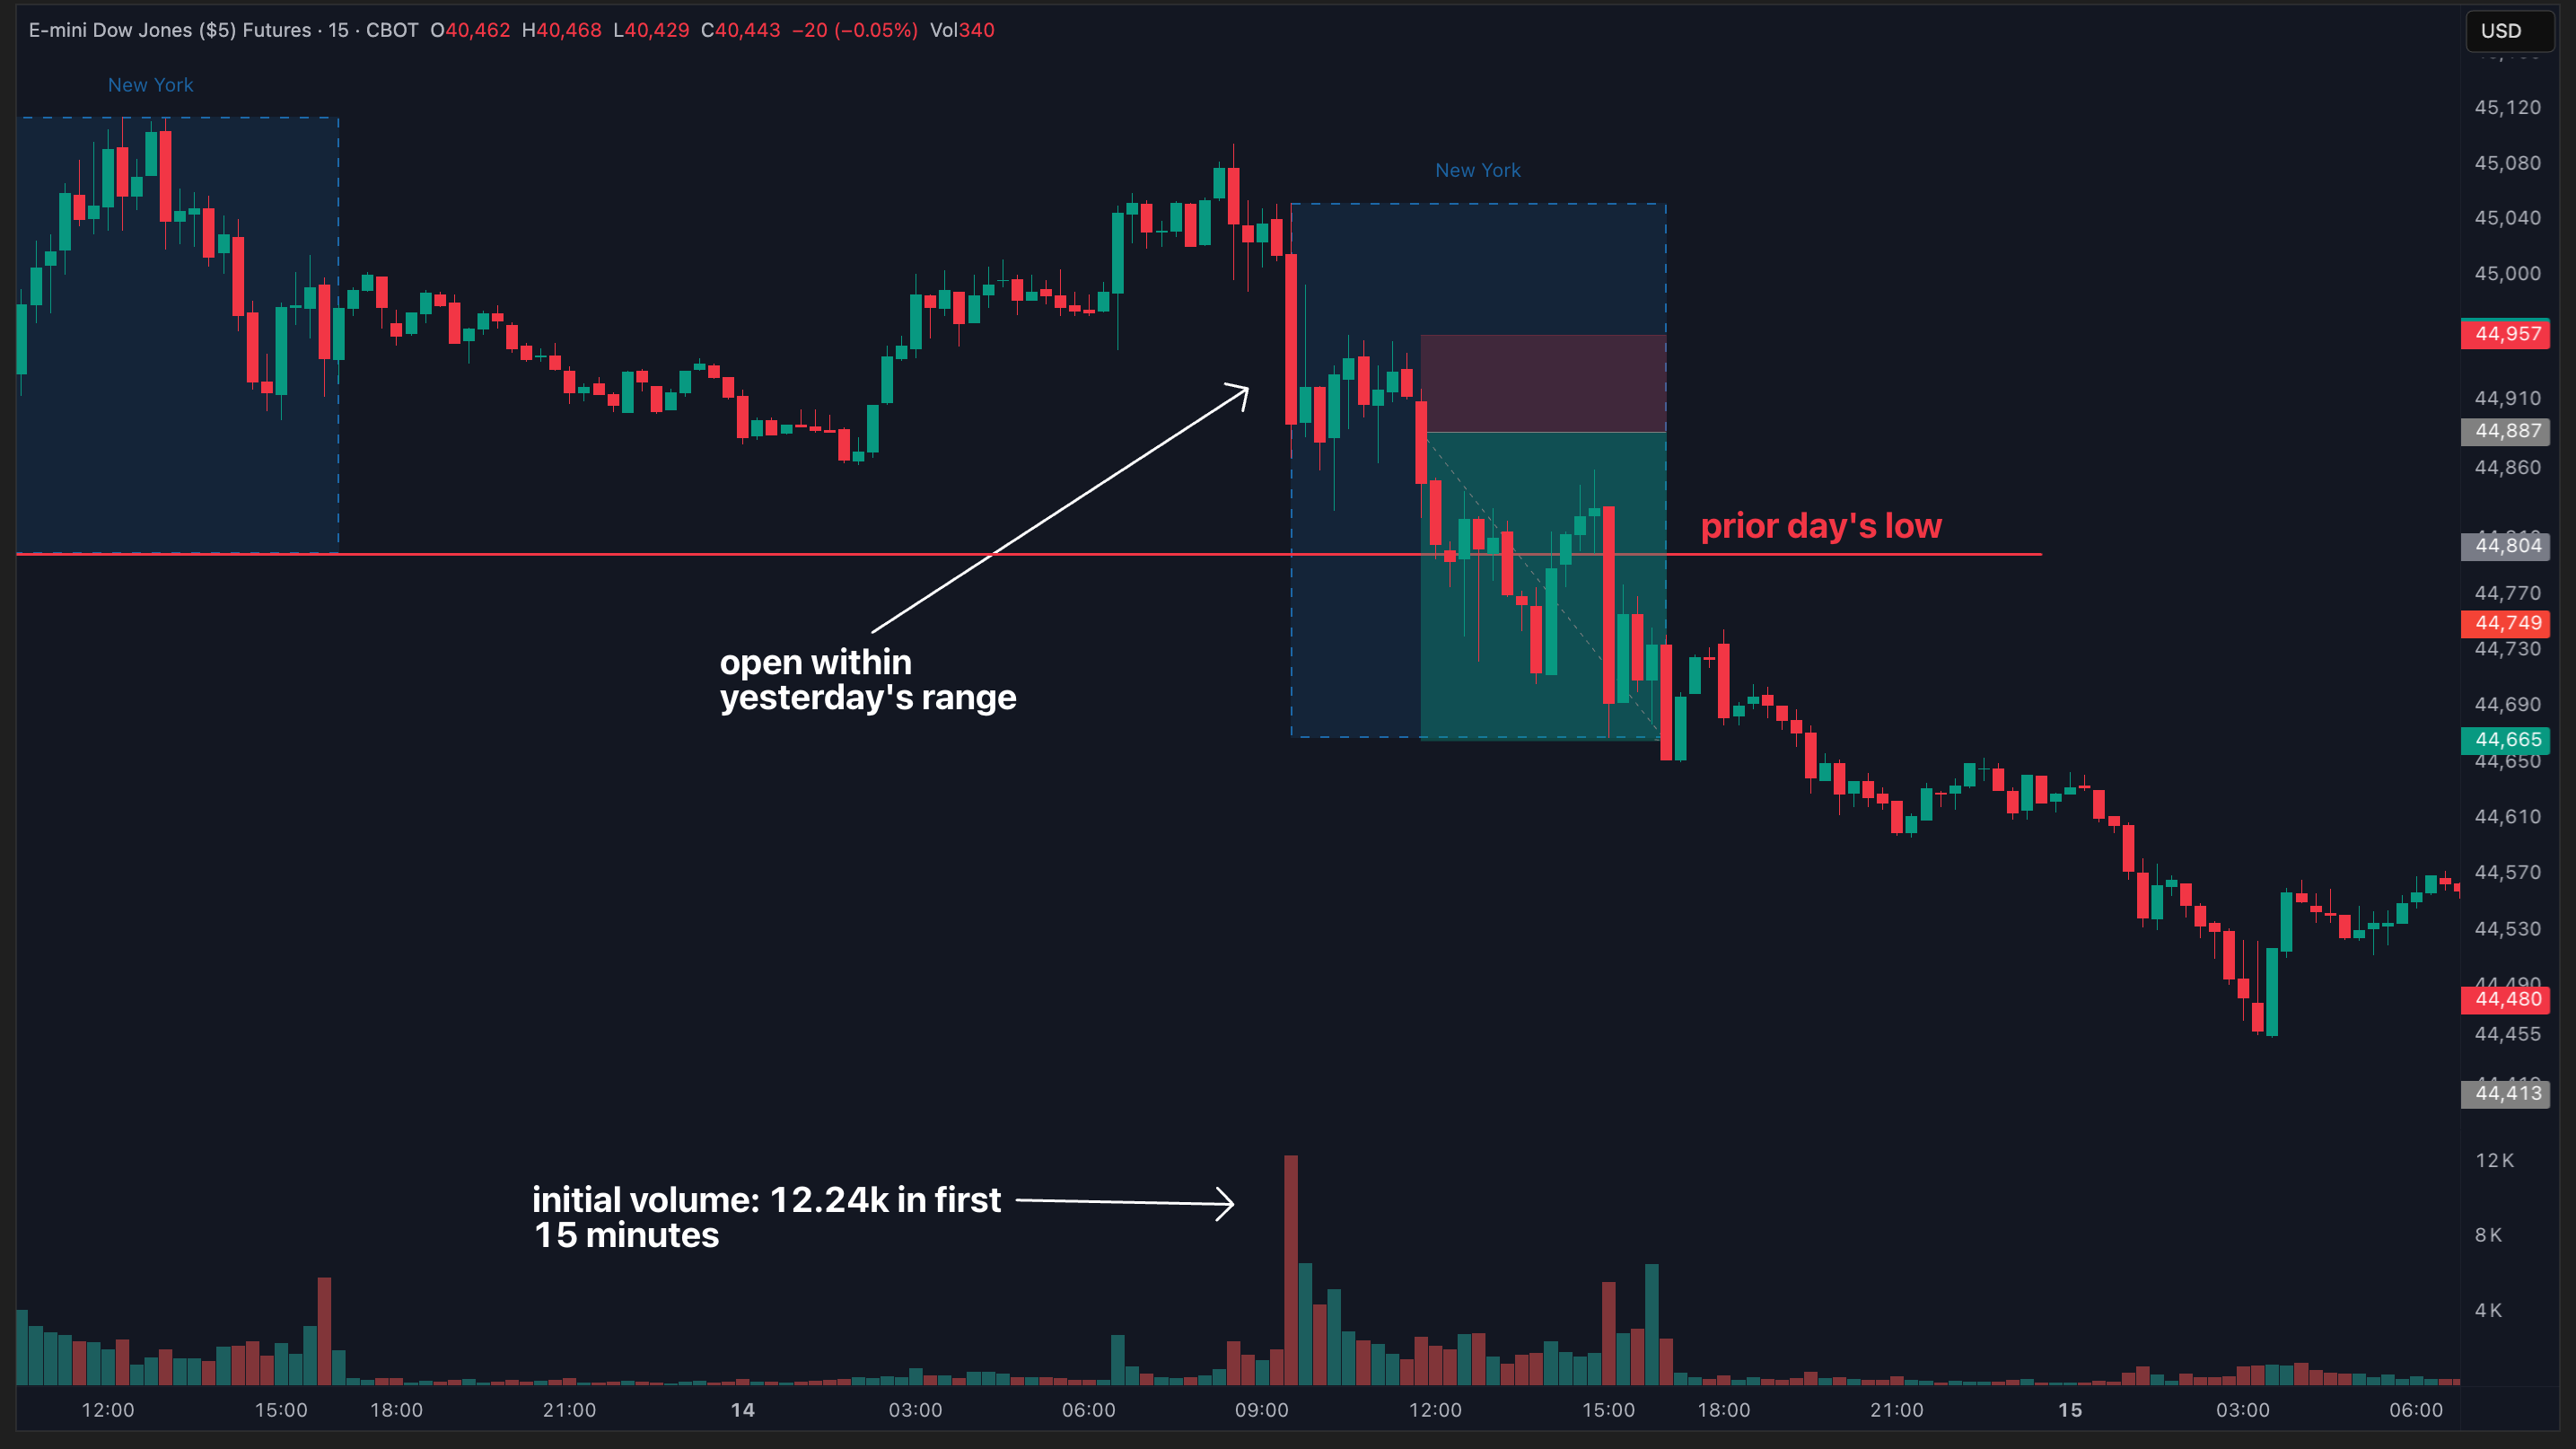
again, here’s that same example from February 21st, with our trade plan laid out:

so if you don’t know how to determine your bias for the session or have a data-backed profit target, the confluence between the OCC, IB, and market session breakout report is your answer.
wrapping up
let's do a quick recap of what we covered today:
- the market session breakout report measures how often one session breaks out of another session’s range (in this example, we looked at how often NY breaks out of the London session’s range)
- on YM, the NY session breaks either the London high or low 83.2% of the time — this is a single break
- on YM, a red opening hour (OCC) on NY results in a red session 66% of the time
- on YM, you can expect a single break of the IB 76% of the time
- you can use the OCC and IB reports to build a bias for which side of the London range is more likely to break
by incorporating the market session breakout report into your trading, combined with the OCC and IB, you’ll be able to build a bias and profit target strategy based on data, not your gut feelings or emotions. and more importantly, you’ll finally start seeing some consistency in your trading.
so take some time to study the report, look at historical examples, and see how you can apply the market session breakout report — as well as the OOC and IB — to your own trading.


