initial balance breakout strategy: how to trade IB setups with real-time market data
what is the initial balance in trading?
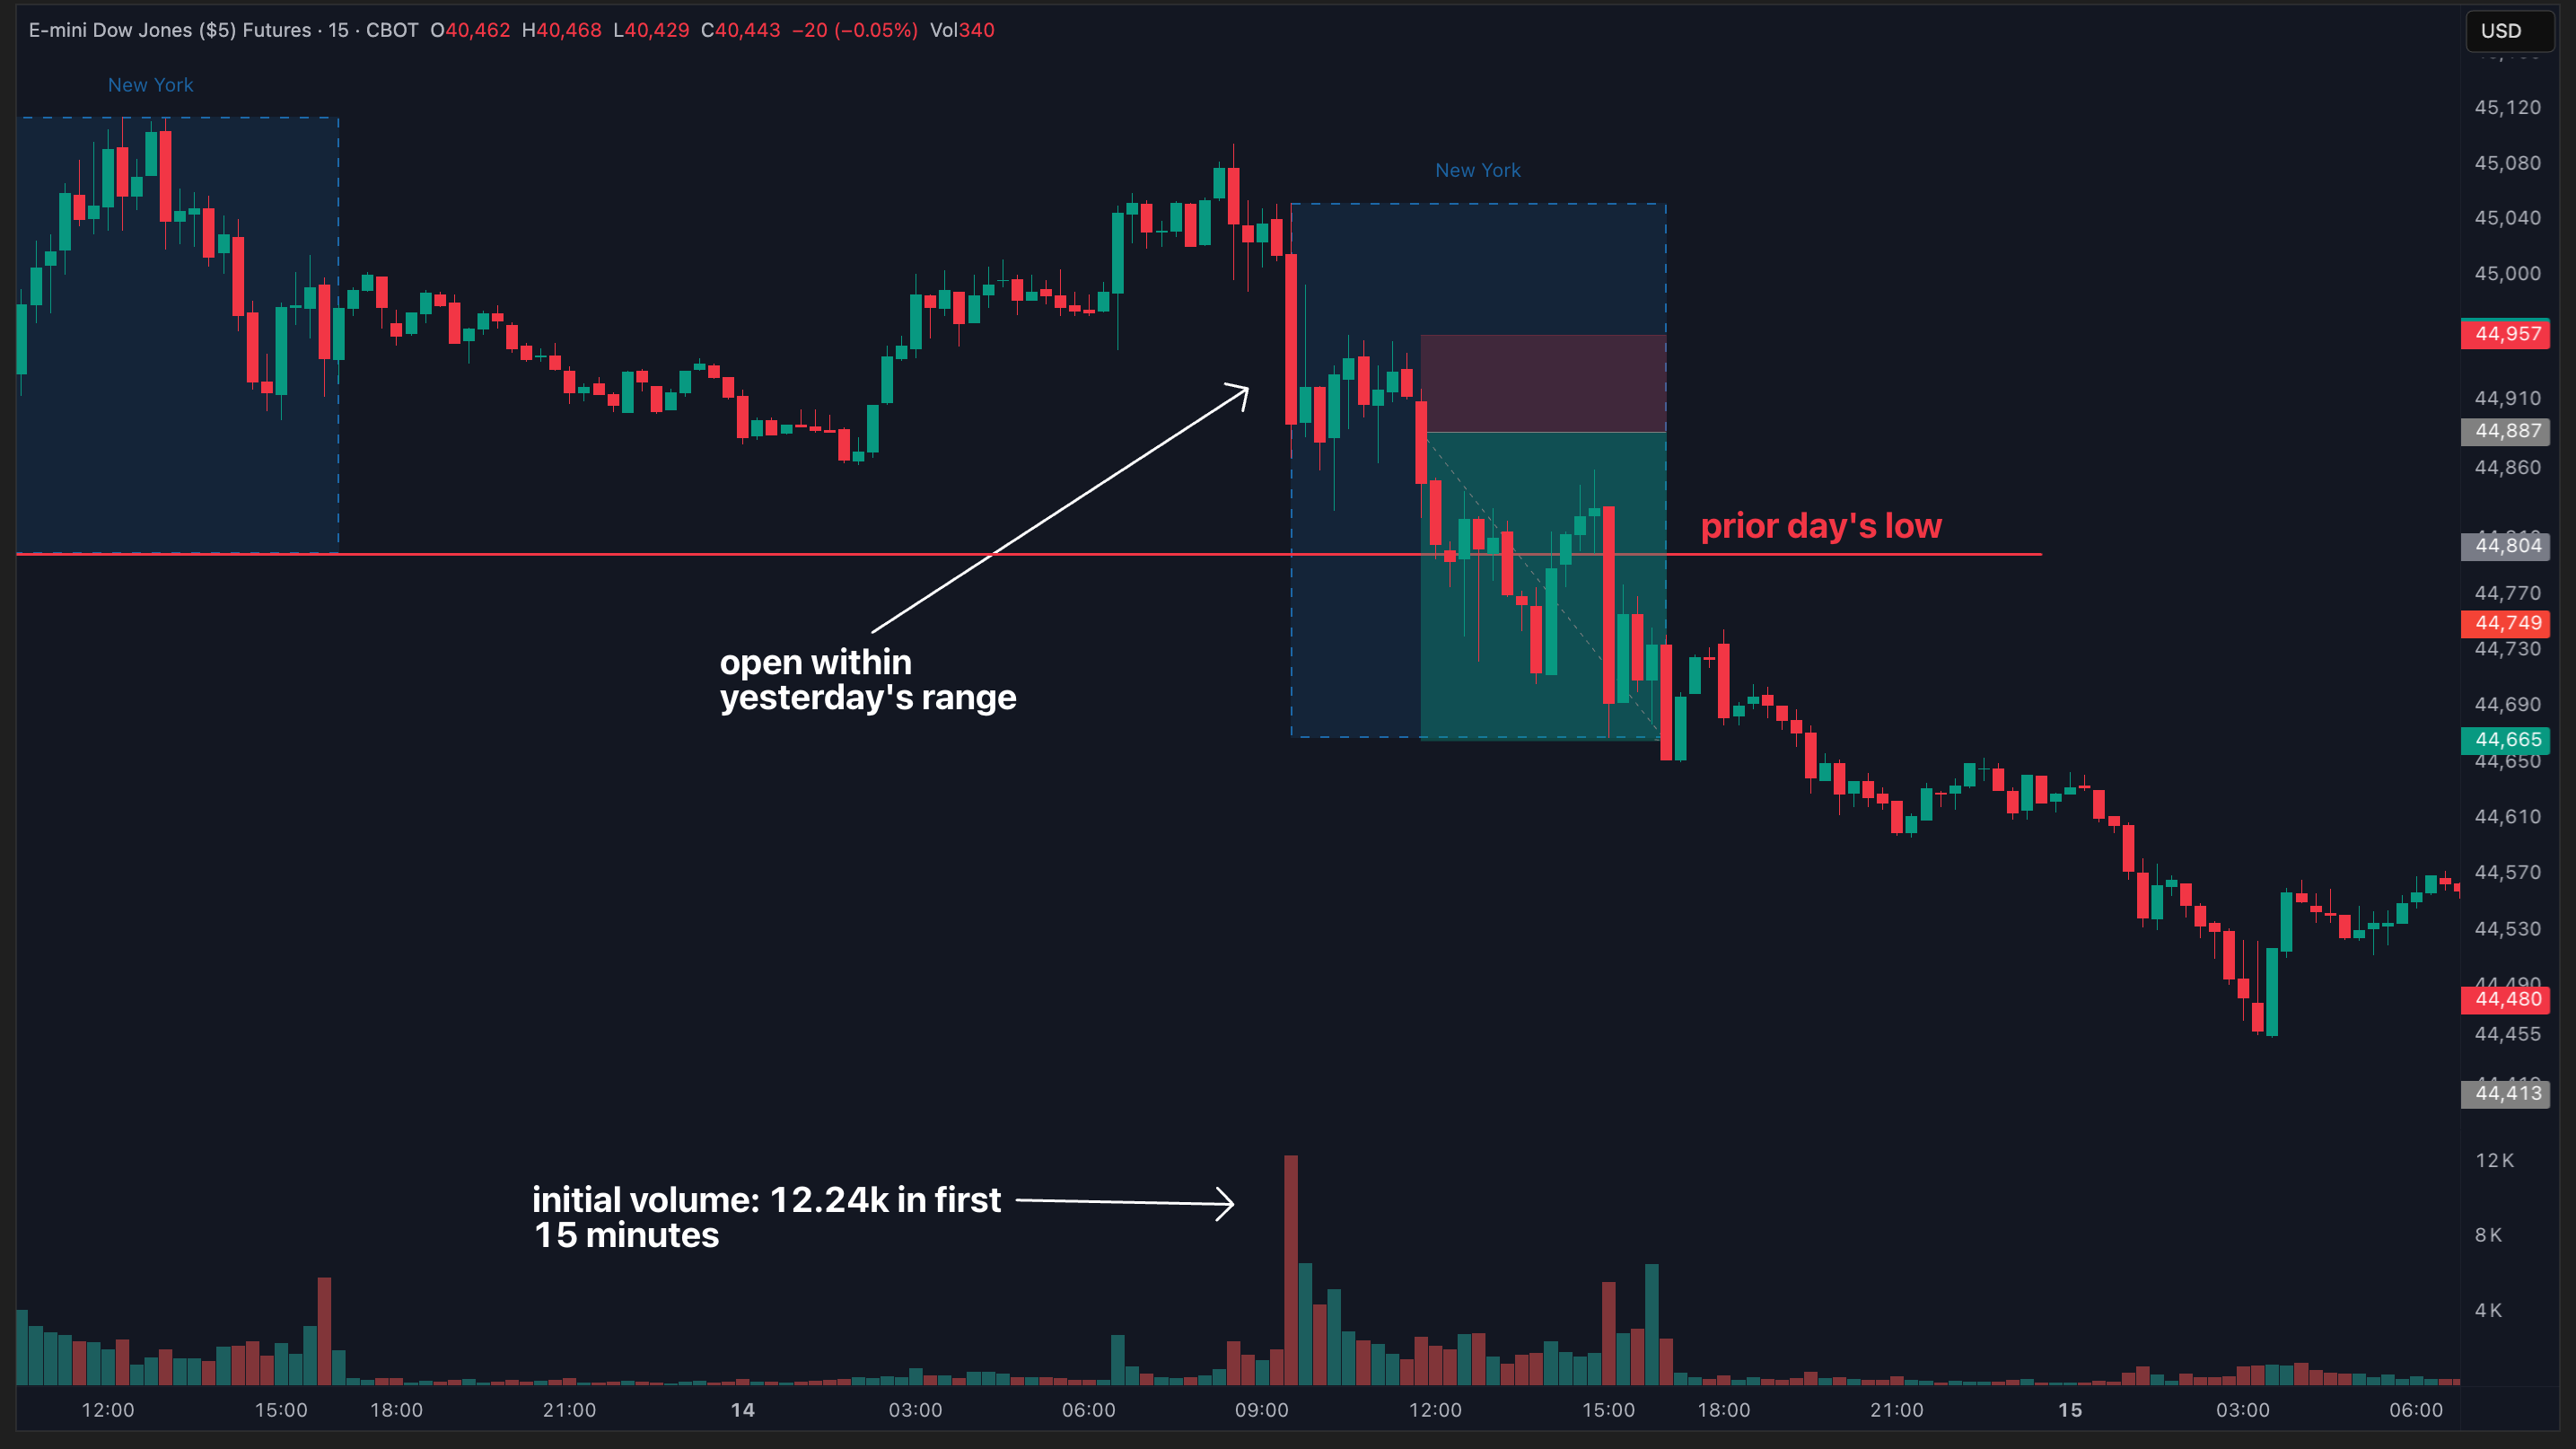
the initial balance is formed by taking the distance between the high of the first hour and the low of the first hour of the trading session.
if you trade the US markets during the NY session, the IB is the high and low of the first hour, from 9:30-10:30AM ET.
why the initial balance breakout strategy works
for many traders who have full time jobs (and full time traders too), trading the first 5, 10, 15, or even 30 minutes can be a volatile time with price making wild moves as the market fights for footing on any given day.
the initial balance breakout strategy is so useful because you:
- allow initial levels of volatility to calm down
- are given a clear range to form your trades on
and, as we’ll see with the initial balance stats, the breakouts from the IB high or low usually continue in that direction for the rest of the session.
how to use edgeful's IB report to trade with data
our IB report gives you key stats behind how price behaves after the first hour of the session. here's what it tells us about QQQ over the past year (from November 13th, 2024 to November 13th, 2023):
key stats on QQQ for the IB report

quick reminder on how to read our reports:
- we’ve selected the initial balance breakout report for the QQQ over the past 1 year of data.
as you can see, the stats say:
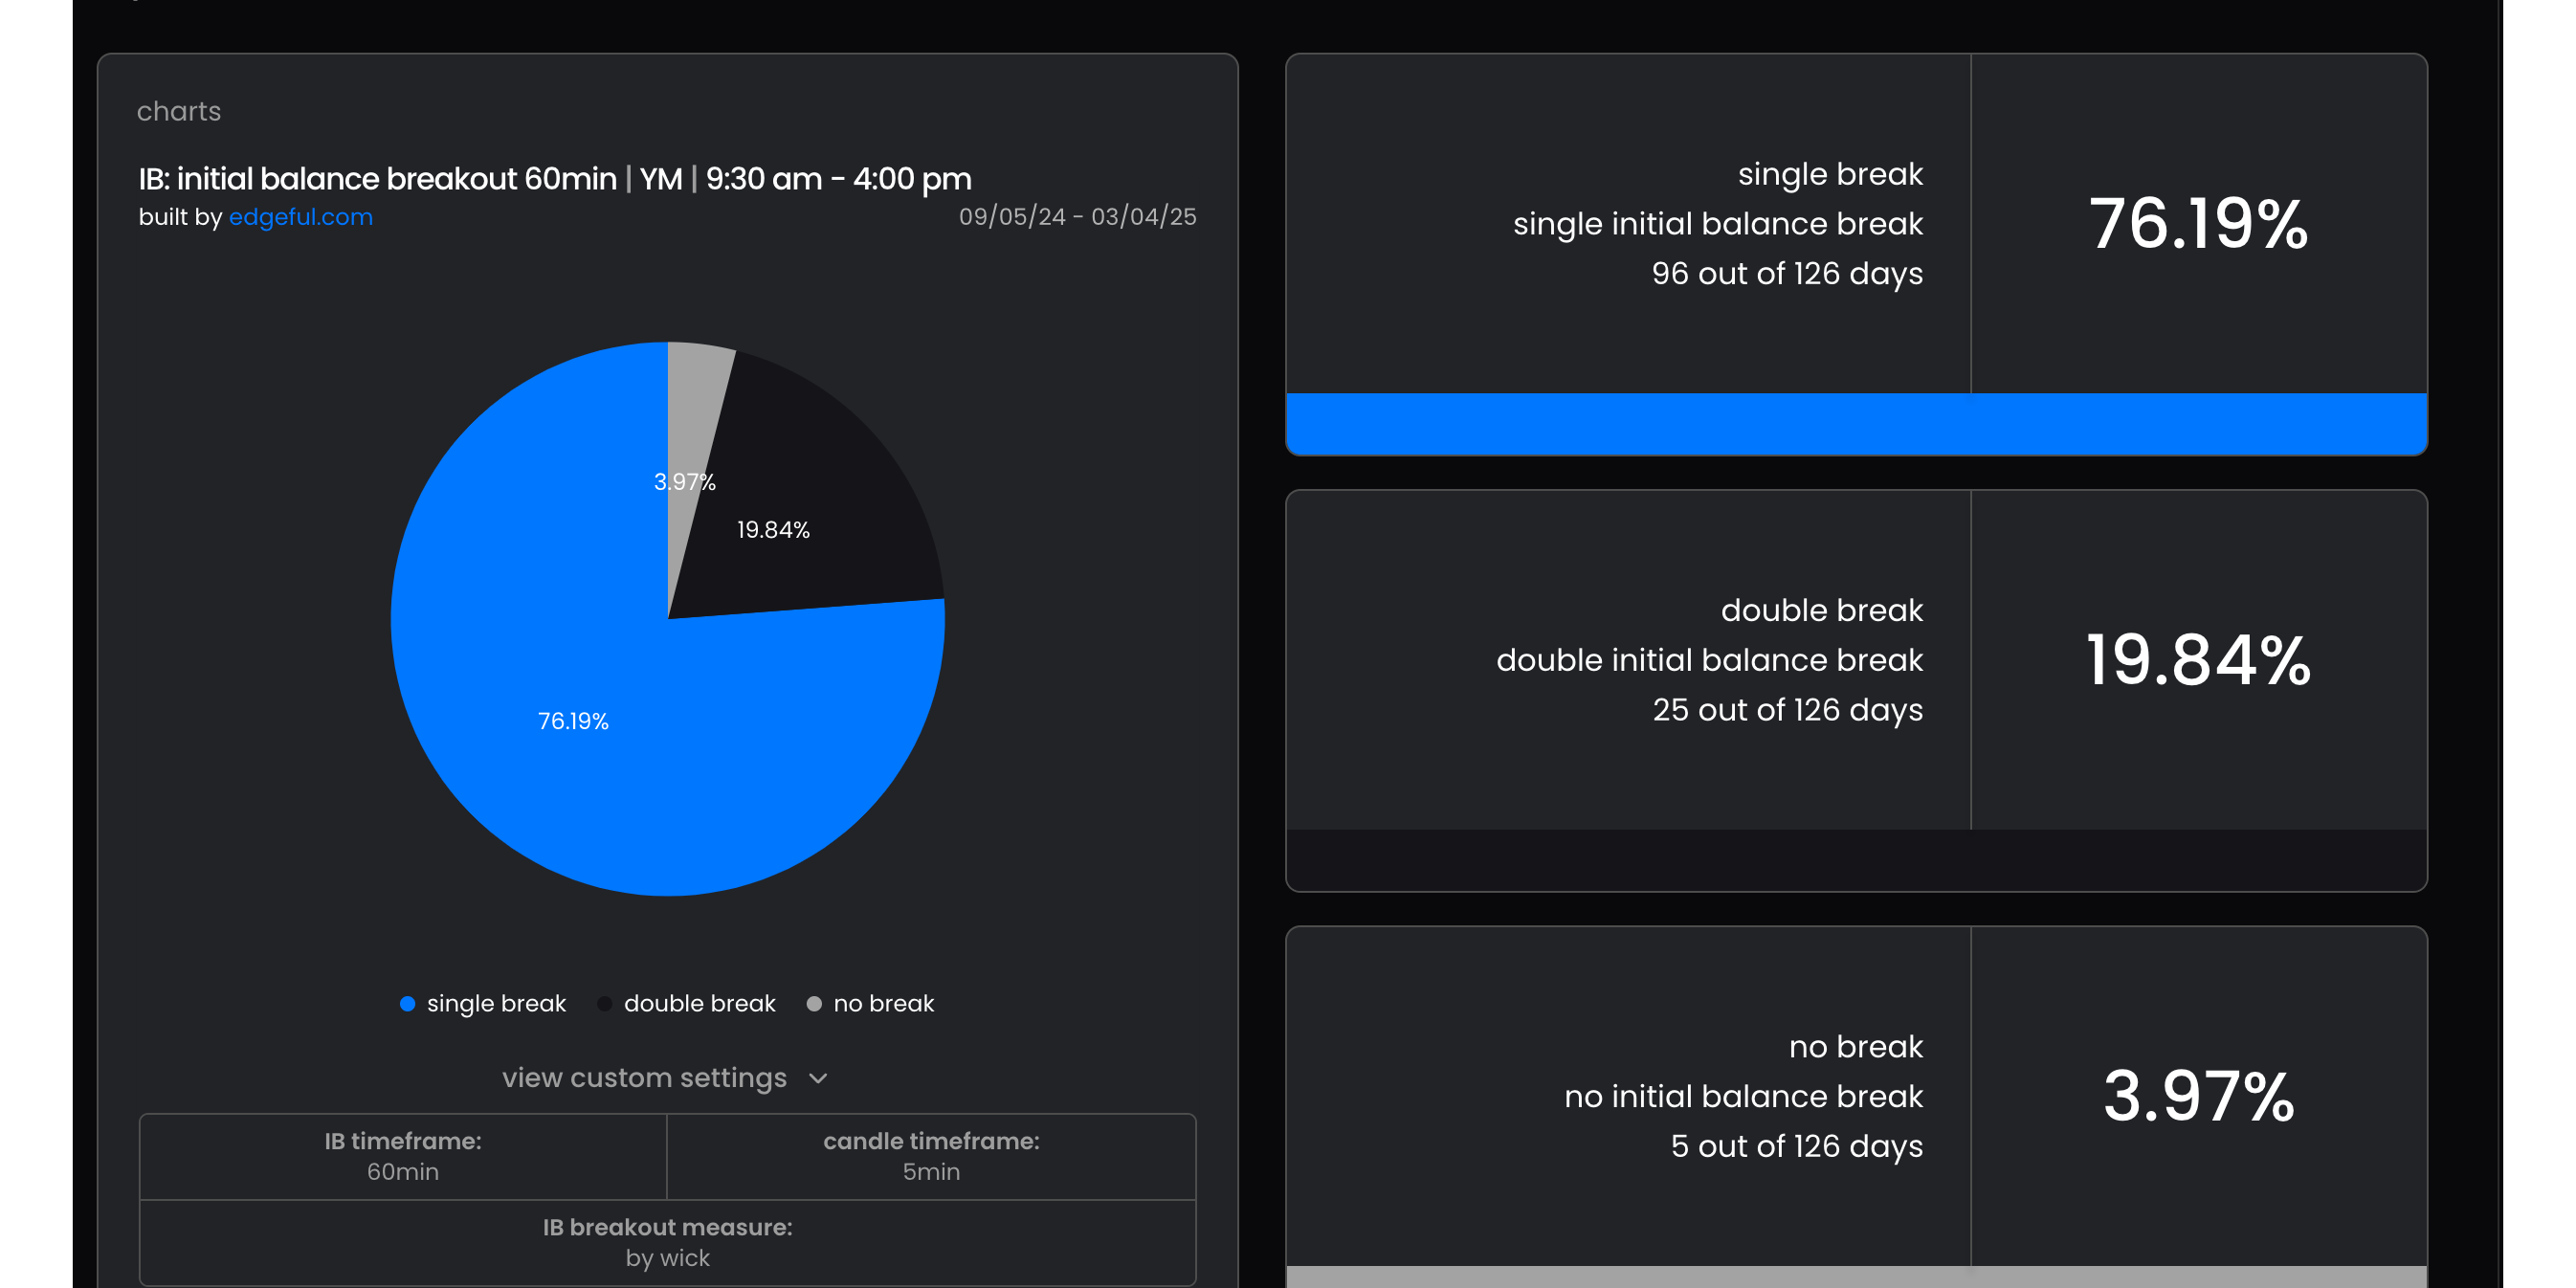
- single breaks — when price breaks only one side of the IB range — happen 72% of the time
- double breaks — when price breaks both sides of the IB range — happen only 25% of the time
- no breaks (price staying within the IB all day) are rare at just 2%
this means that once price breaks one side of the initial balance, it's unlikely to fully reverse and break the other side.
you can use this data to set price targets & data-based stop losses, applying what price has done in the past to build trade plans in the present/future.
how to set profit targets using the IB extensions report
as we said earlier, waiting for the first hour of trading to close is an edge visualized through the initial balance report.
but how far can you expect price to go after breaking the IB? that's where our IB 'by performance' report comes in:

over the past year...
- QQQ averages a 0.14% move above the IB high
- QQQ averages a -0.21% move below the IB low
- the max upside move is 1.41%
- the max downside move is -1.94%
with these stats, you can clearly see where to be taking profits on both your long trades & short trades using the initial balance range.
what the 'by close" IB subreport shows
in this report, we’re looking to see where price is likely to close in relation to the initial balance range (between the high and the low). as you can see, over 41% of the time over the past year, the QQQ has closed within the IB high and low.

we’ll talk about how you can apply these stats in the real world examples next…
real world examples of the initial balance breakout strategy
before we dive into examples, let’s quickly recap the stats above and how we can use them to analyze some examples:
- a single break of the IB high or low happens 72% of the time over the past year on QQQ
- avg. breakout extension is 0.14% to the upside and -0.21% to the downside on QQQ
- QQQ closes between the IB high & low ~42% of the time over the past year (33% above IB high, 25% below IB low)
the application:
you should be looking for a breakout or breakdown of the IB high/low, and setting your profit targets in the 0.14% range for upside breaks and -0.21% for downside breaks, expecting price to most likely close back within the initial balance range.
okay, now on to some examples:
example: november 7th, 2024:
the green line represents the initial balance high, and the red line represents the initial balance low. here we can see a slight gap up on the QQQ that consolidates near the IB high and then breaks out.
- entry: IB high breakout
- stop loss: below consolidation lows
- profit target: reaches 0.3%, nearly 2x the 0.14% average extension
- expectation: price closes back within IB range
the only part of our trade that didn’t follow the plan above (using our stats!) was the close.

example: november 12, 2024
no gap in either direction to open the session, so you could be watching the IB break for your bias.
here we get a IB breakdown, which you could have shorted & covered into the avg. extension area we’ve mentioned above.
price then rallies by the end of the session to close within the IB range, following our stats nearly perfectly (has happened 42% of the time over the past year).

we could keep giving you examples all day, but hopefully you get the point.
your 5-step initial balance breakout trading plan
before we go, we wanted to leave you with a step by step process to build an IB trading plan:
- step 1: wait for the first hour to close before making any trades!
- step 2: check the IB ‘standard’ report to see how often price breaks to one side vs. both
- step 3: check the IB ‘by performance’ report to see levels of extensions & set price targets
- step 4: check the IB ‘by close’ report to see where price is likely to close by EOD
- step 5: use the examples above to visualize both long & short IB setups, then trade!
and there you have it - a data-driven, step-by-step plan for trading the initial balance.
if you'd also like a video breakdown of the Initial Balance report, click here.
if you’re an edgeful subscriber already, click here to go directly to the IB breakout reports.
if you’re not an edgeful subscriber and are ready to try us out, what are you waiting for? come try us out by clicking the button on the top right of your screen!