holding for bigger moves: combine these 4 edgeful reports to build more confidence in your trades
my goal by the end of today’s blog is simple:
I’m going to show you exactly how to use the data across 4 different reports to build enough confidence to finally start holding for bigger moves — and stop getting shaken out because you’re scared when price pulls back a couple points against you.
here's exactly what we're going to cover:
- the inside bars report — which shows you what key levels act as strong targets
- the opening candle continuation report — which gives you a bias within the first hour
- the initial balance report — which tells you if your bias is likely to continue or reverse
- the previous day's range report — more confirmation of a continuation or reversal
- a real example on ES from March 13, 2025 showing how these 4 reports align
step 1: the inside bars report | identifying your targets
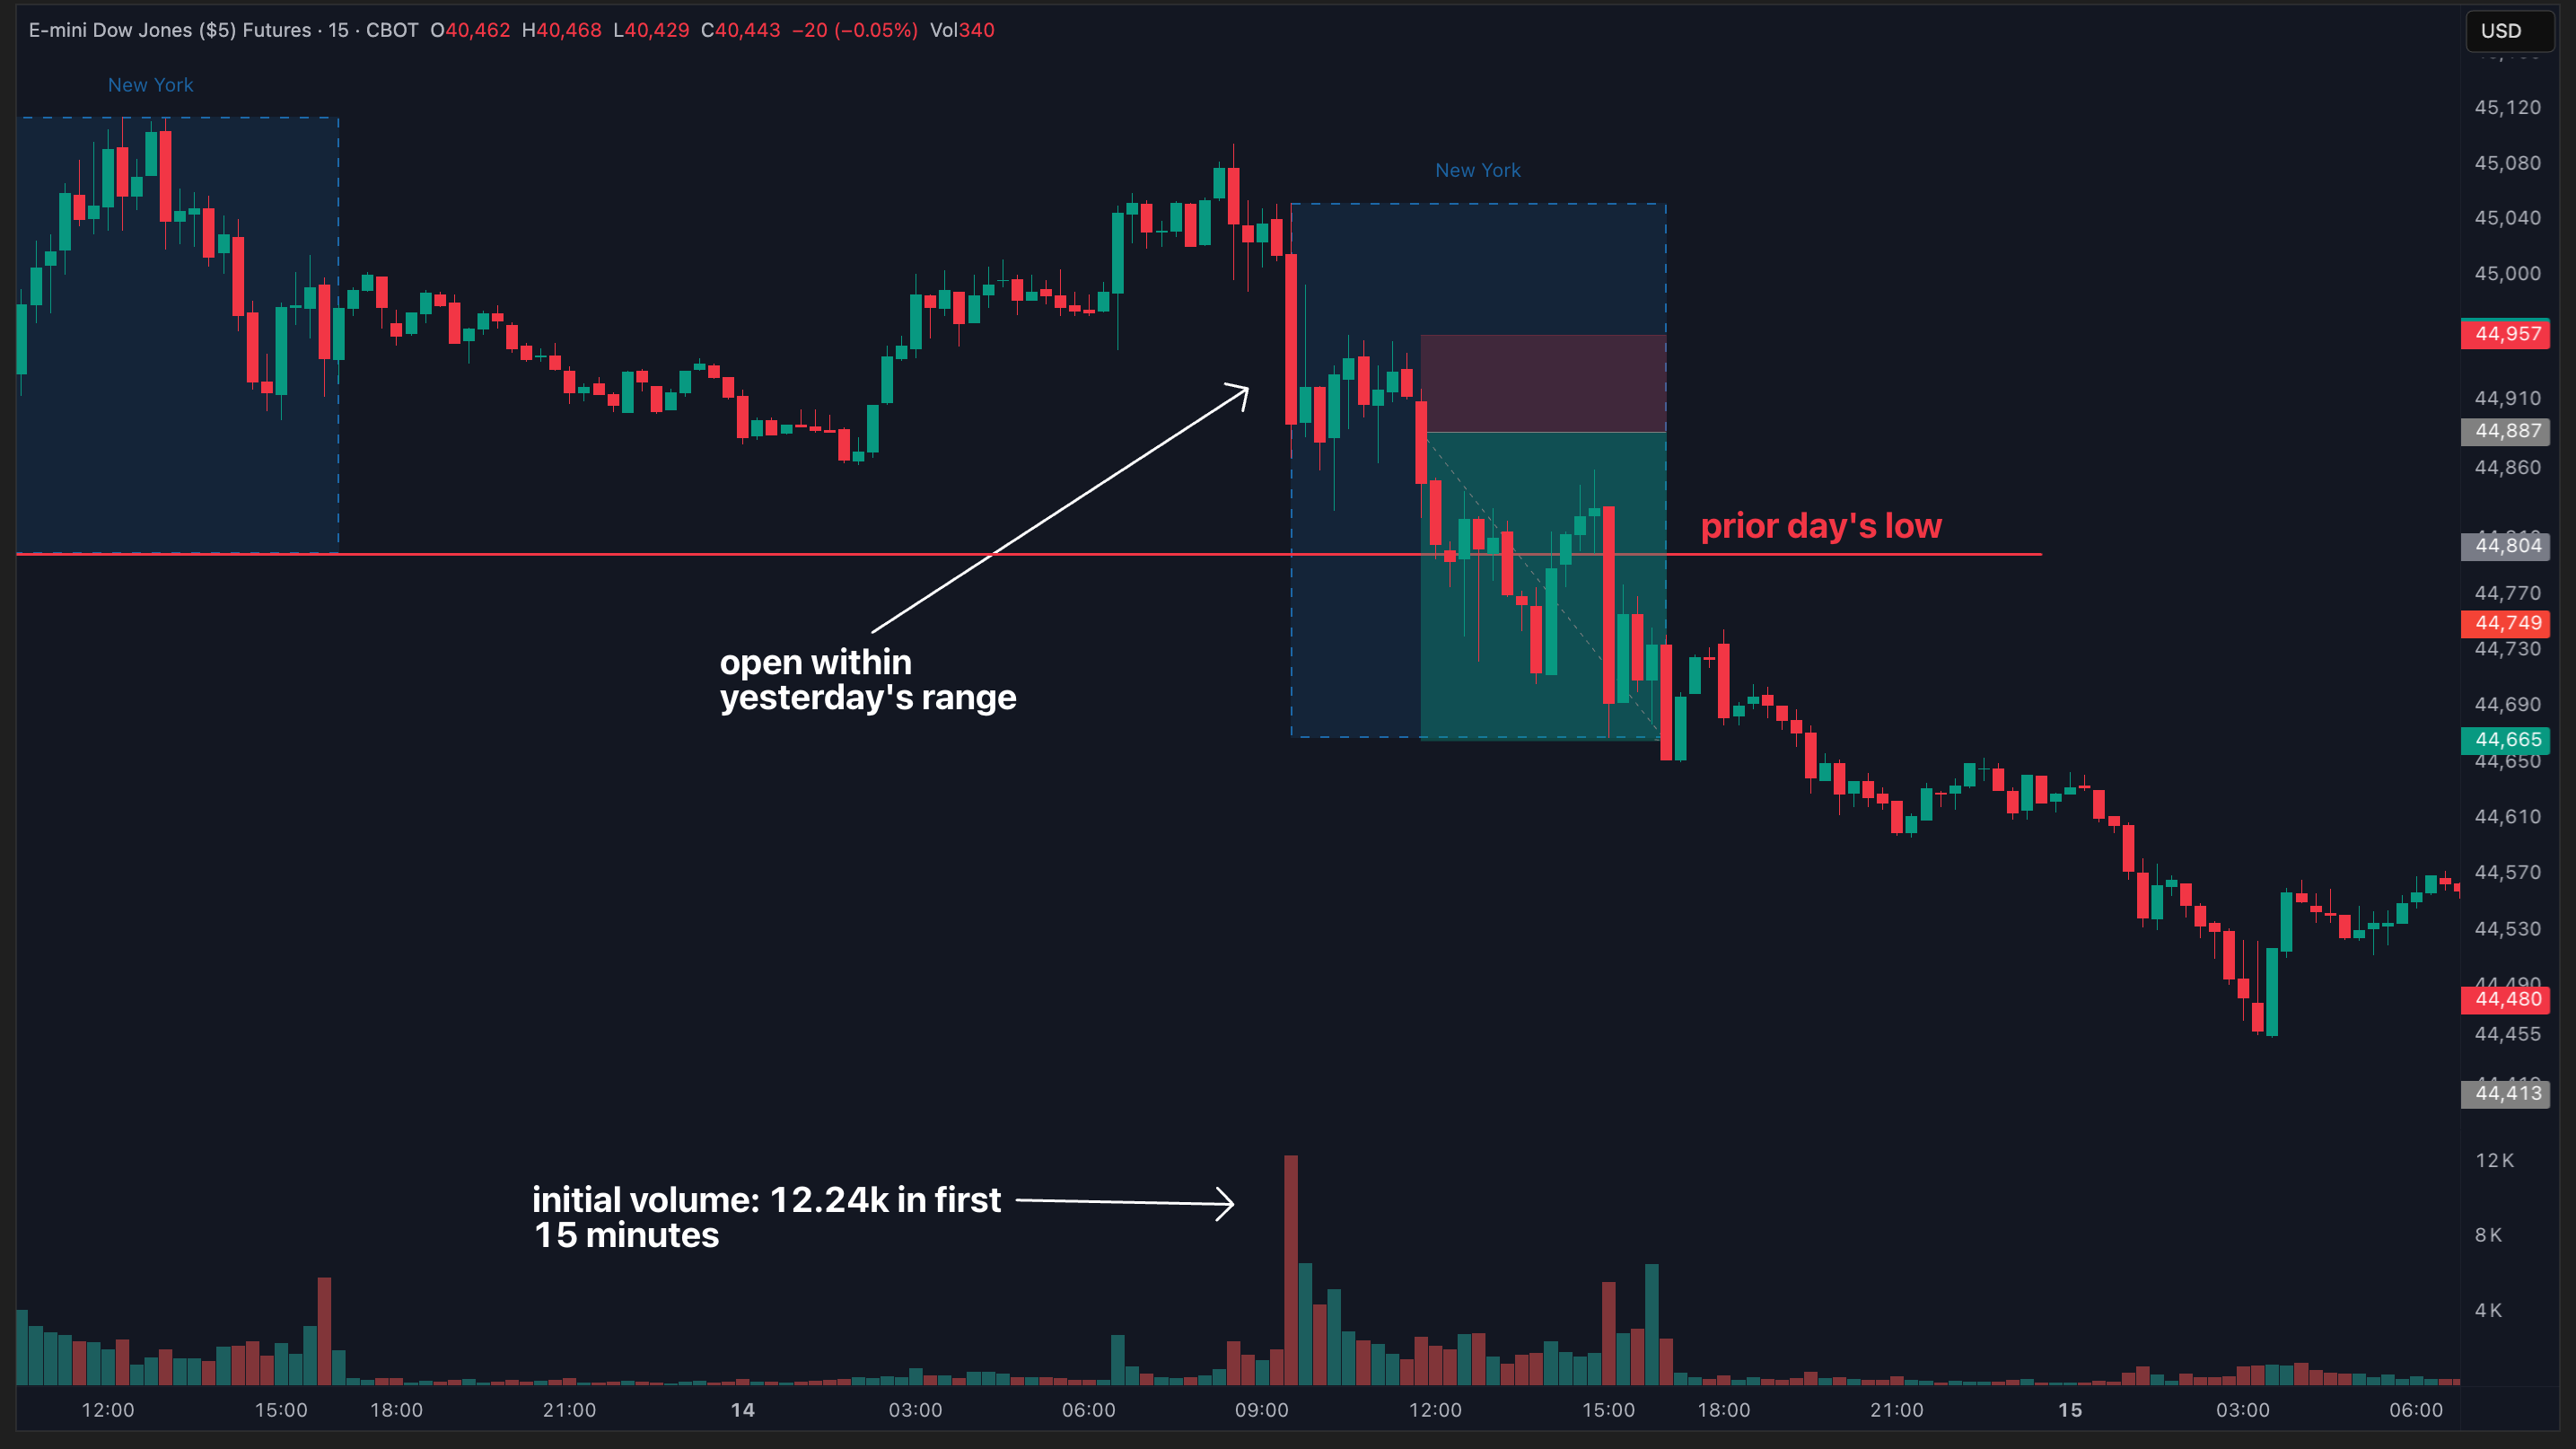
the inside bars report measures what happens when price opens within the previous day's range. specifically, we’re looking at how often price breaks out of yesterday’s range and tests either yesterday's high or low.
for today’s stay sharp, I’m going to be focused on ES during the New York session. so — price has to open within yesterday’s New York high and low for it to count using the inside bars report.
here's what the stats say for ES over the last 6 months:

- when price opens within the previous session’s range, it will break either yesterday's high or low 80.25% of the time
- only 19.75% of the time does price stay completely within yesterday's range
you can now target these levels with confidence because at least one of them gets touched nearly every single day — a powerful insight when it comes to holding for bigger moves.
step 2: the opening candle continuation report | establishing your bias
the opening candle continuation (OCC) report is one of my favorites for establishing an early bias in the session. it looks at the first hour of trading (9:30AM—10:30AM ET) and measures how often the color of that candle matches the color of the entire session.

here's what the data tells us for ES:
- if the first hour is green, the session closes green 75% of the time
- if the first hour is red, the session closes red 65% of the time
let’s combine this with what we just learned:
- if price opens inside yesterday's range, you know there's an 80% chance it breaks out
- if the first hour is green, you now have a 75% chance the day will also close green → target yesterday’s high
- if the first hour is red, you’ve got a 65% chance the day closes red → target yesterday’s low
with this, you now have a directional bias and confidence in your targets — two key ingredients for holding for bigger moves without fear.
step 3: the initial balance report | confirming direction and conviction
the initial balance (IB) is the range from the first hour of trading (9:30AM–10:30AM ET). this report tells us how often price breaks:
- only one side of the IB (single break)
- both sides (double break)
- neither side (no break)
on ES over the last 6 months:

- single break days happen 77.6% of the time
- double break days only happen 20.8% of the time
- price stays fully inside the range just 1.6% of the time
here’s how this adds to our thesis:
- use your OCC bias to determine which side of the IB you're expecting to break
- once that side breaks, the IB report tells us it's likely to continue in that direction
- this reinforces the idea of holding for bigger moves once price confirms your bias
step 4: the previous day's range report | confirmation of continuation
this underrated report measures what happens after price breaks yesterday's high or low — specifically, whether that breakout signals continuation or reversal.
we’re using the previous close to close calculation for this analysis (preferred by swing traders). this means we're calculating a red or green day by comparing today's close to yesterday's close.
the other calculation method is taking today's close and comparing it to today's open — this is preferred by day traders.
here are the previous close to close stats on ES:

- when yesterday's high breaks → the session closes green 80% of the time
- when yesterday's low breaks → the session closes red 75% of the time
most traders think these levels are reversal points. the data tells us otherwise — they’re continuation signals.
knowing this gives you a final layer of confidence to stay in the trade longer and keep holding for bigger moves.
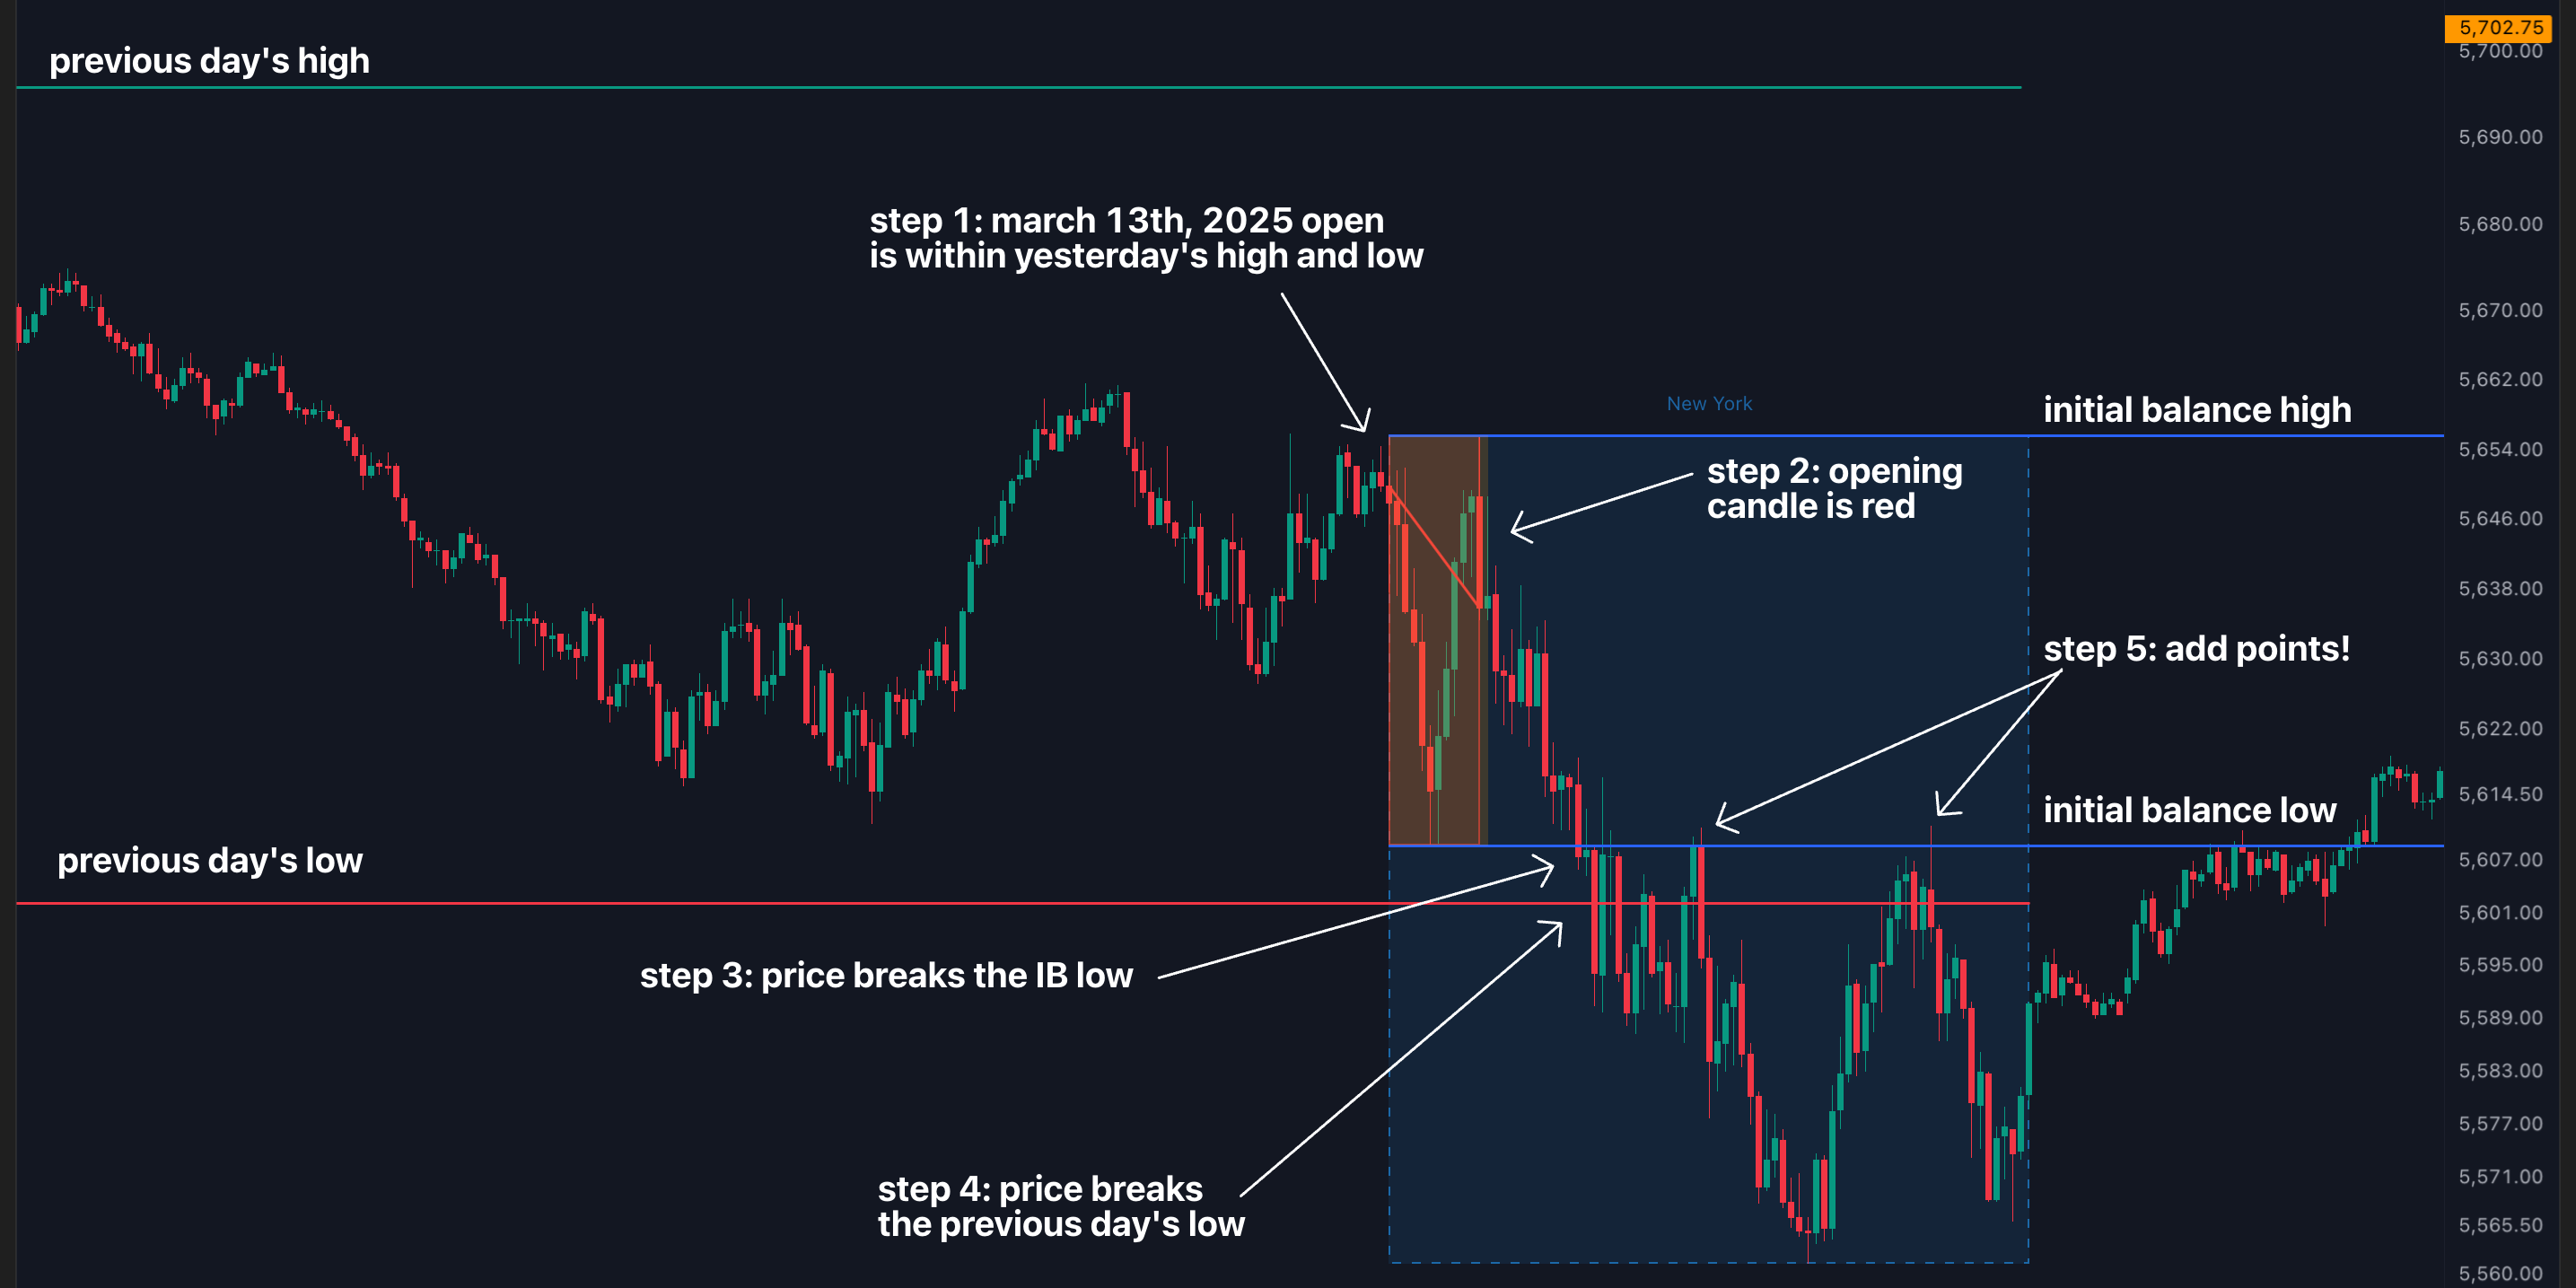
step 5: how to hold for bigger moves using real-time data — March 13, 2025 on ES
let’s walk through this real example on ES, step by step:

- inside bars report: ES opens within yesterday's range
→ 80.25% chance it breaks either yesterday’s high or low - opening candle continuation: first hour closes red
→ 65% chance the session closes red
→ bias shifts bearish, we’re targeting yesterday’s low - initial balance report: price breaks below IB low
→ 77.6% of single break days hold in one direction
→ this confirms our bearish bias and gives us confidence to stay in - previous day's range report: price breaks yesterday’s low
→ 75% chance the day closes red
all signs pointed in the same direction. this is a textbook case of using data to hold for bigger moves — not just react emotionally when price pulls back slightly.
when reports conflict — how to stay smart and manage risk
sometimes, the reports won’t all agree.
maybe the OCC is green, but price breaks below the previous day’s low. here’s what to do:
- wait for more confirmation before entering
- reduce size or tighten stops
- don’t force A+ conviction when the data doesn’t support it
but when everything aligns — like it did on March 13th — you’ve got the confidence and stats to size up and hold for the full move.
wrapping up: the edgeful blueprint for holding for bigger moves
let’s review:
- inside bars report → defines key high/low targets
- OCC report → gives directional bias early
- IB report → confirms trend is likely to continue
- previous day's range report → proves breakouts lead to continuation
using all four together gives you:
1) clear bias
2) strong levels to target
3) conviction to hold for bigger moves
if you're serious about leveling up your execution, you need to study these reports daily. other traders are still reacting to emotions. you’ll be reacting to data — and trading with confidence.