green and red streak trading strategy: the 2-day rule for market reversals
why trends matter for traders
most traders get caught in trends that are already exhausted, buying after multiple green days or selling after multiple red days — only to watch the market reverse against them.
what if you could use data to know when a trend is likely to reverse?
in this post, I'm going to show you exactly how to use the green and red streaks report to anticipate market reversals before they happen, giving you a systematic approach to both entering trades and taking profits.
what is the green & red streaks report?
the green and red streaks report measures consecutive up or down days and provides you with the average and maximum length before a reversal typically occurs.
looking at YM (dow futures) in the NY session over the last 6 months, the data tells us:

- the average consecutive green streak is about 2 days
- the average consecutive red streak is also about 2 days
- the maximum consecutive red days was 11 — that's just over 2 weeks of red
- the maximum consecutive green days was 7 — just over a week straight of green
so why does this matter?
knowing that streaks typically only last around 2 days, you can use data to avoid getting emotionally attached to a swing trade — thinking that price will go in your direction forever — and take profits into a multi-day move.
or if you’re a day trader, you can look for a reversal trade after 2 or more consecutive days in one direction. I’ll cover more applications for both swing and day traders in a second, but first we need to understand the two ways a green or red day is calculated:
the two calculation methods: understanding green vs. red days
before we can apply this knowledge, we need to understand the two different ways of defining what constitutes a "green" or "red" day:
method 1: open-to-close (edgeful's default)
this method only looks at the open and close of the current session. if the close is higher than the open, it's a green day. if the close is lower than the open, it's a red day.
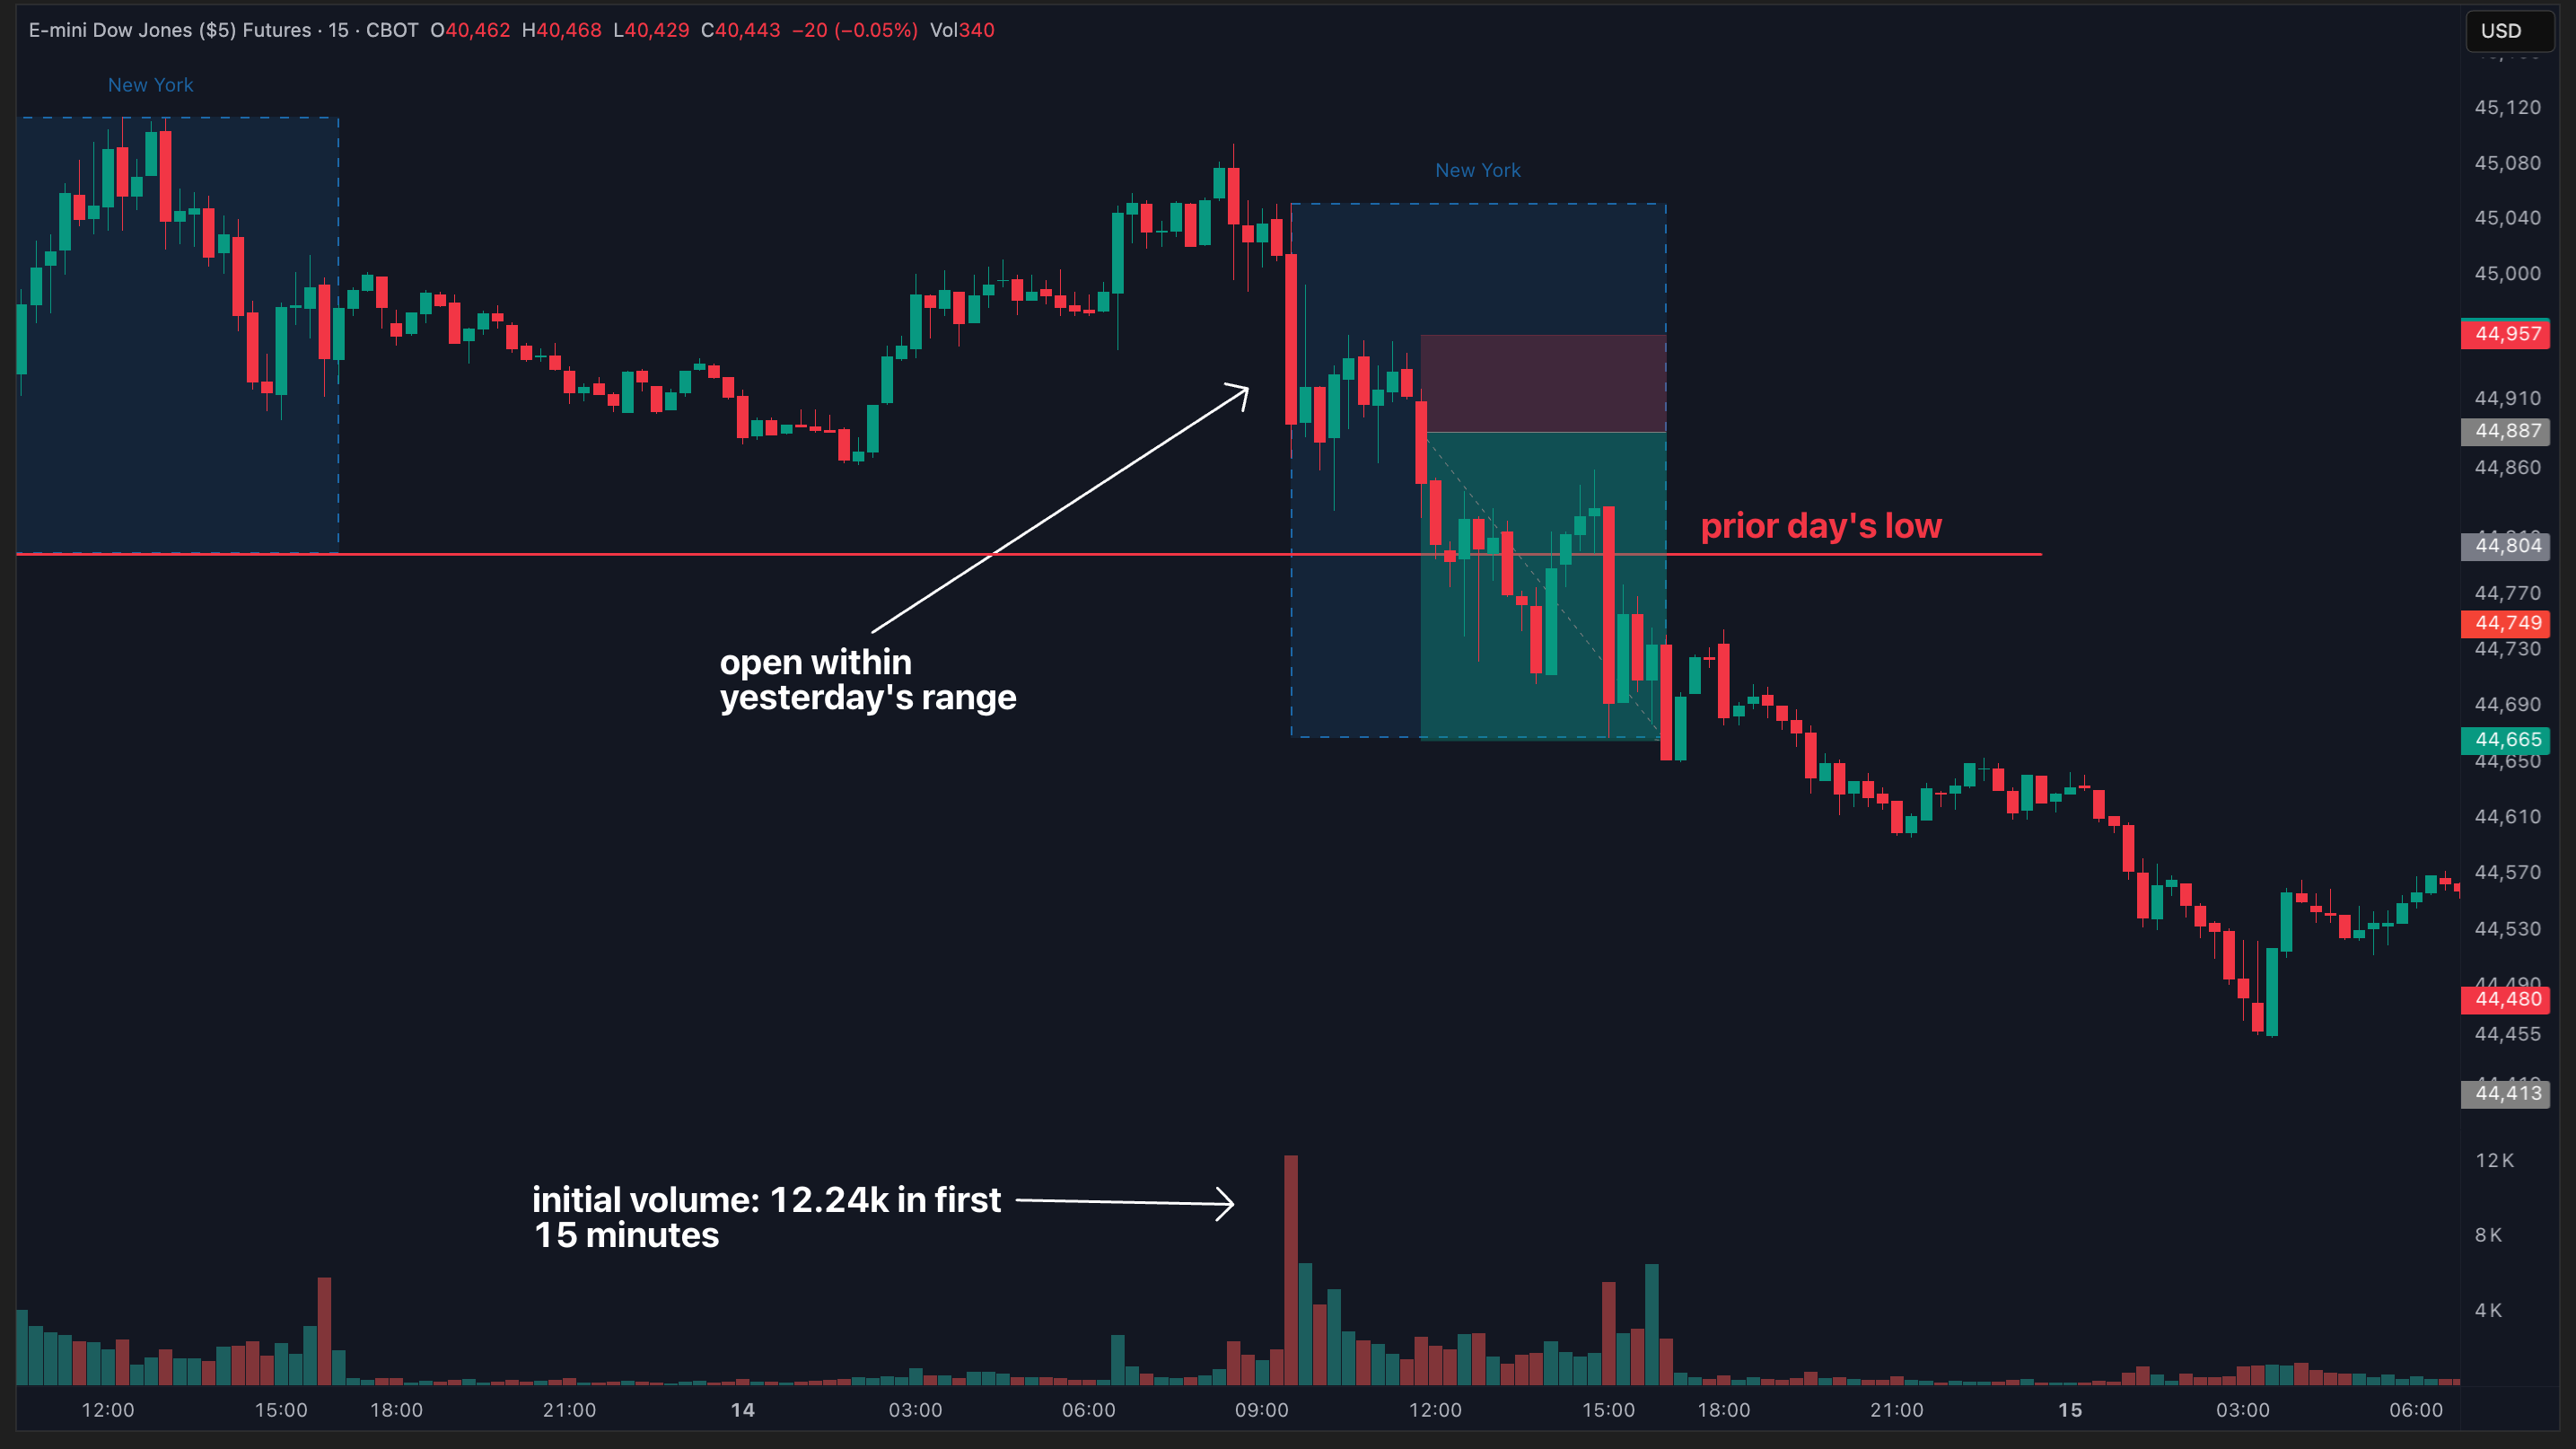
for example, looking at February 12th on YM — the open-to-close calculation shows this as a green day because price closed higher than where it opened, regardless of what happened the previous day:

here are the stats on YM, during the NY session, over the last 6 months using the open-to-close calculation:
- max green days: 7
- max red days: 11
- avg. green days: 1.79
- avg. red days: 1.91
what do these stats mean?
the data is telling us that using the open to close customization, green days where today’s close is above today’s open — reverse after 1.79 sessions (on average). red days — where today’s close is below today’s open — reverse after 1.91 sessions, on average.
this data can be used to improve timing on your profit targets, as well as develop an overall bias on the session.
more on that in a bit. let’s cover the second method:
method 2: previous-close-to-close
this method compares today's close to the previous session's close. if today's close is higher than yesterday's close, it's a green day. if lower, it's a red day.
using that same February 12th example — the previous-close-to-close method shows this as a red day because price closed below the previous day's closing price, even though it closed above where it opened:

this calculation method is typically more relevant for swing traders who hold positions overnight.
here are the stats on YM over the last 6 months, using the previous close to close customization:

applying streak data to your trading: real-world examples
now let's explore how to actually use this data to improve your trading:
for swing traders (using previous-close-to-close)
if you're a swing trader holding positions for 1-3 days, the streak data becomes especially valuable.
when you see 2 consecutive red days on YM (the average streak length), you know that:
- the probability of a third red day is statistically lower based on the data
- if you're already short, this is a data-backed signal to consider taking partial or full profits
- if you're looking to get long, a potential reversal after 2 red days offers a favorable risk-to-reward entry point
- as a streak extends beyond the average (2 days), a reversal becomes increasingly likely
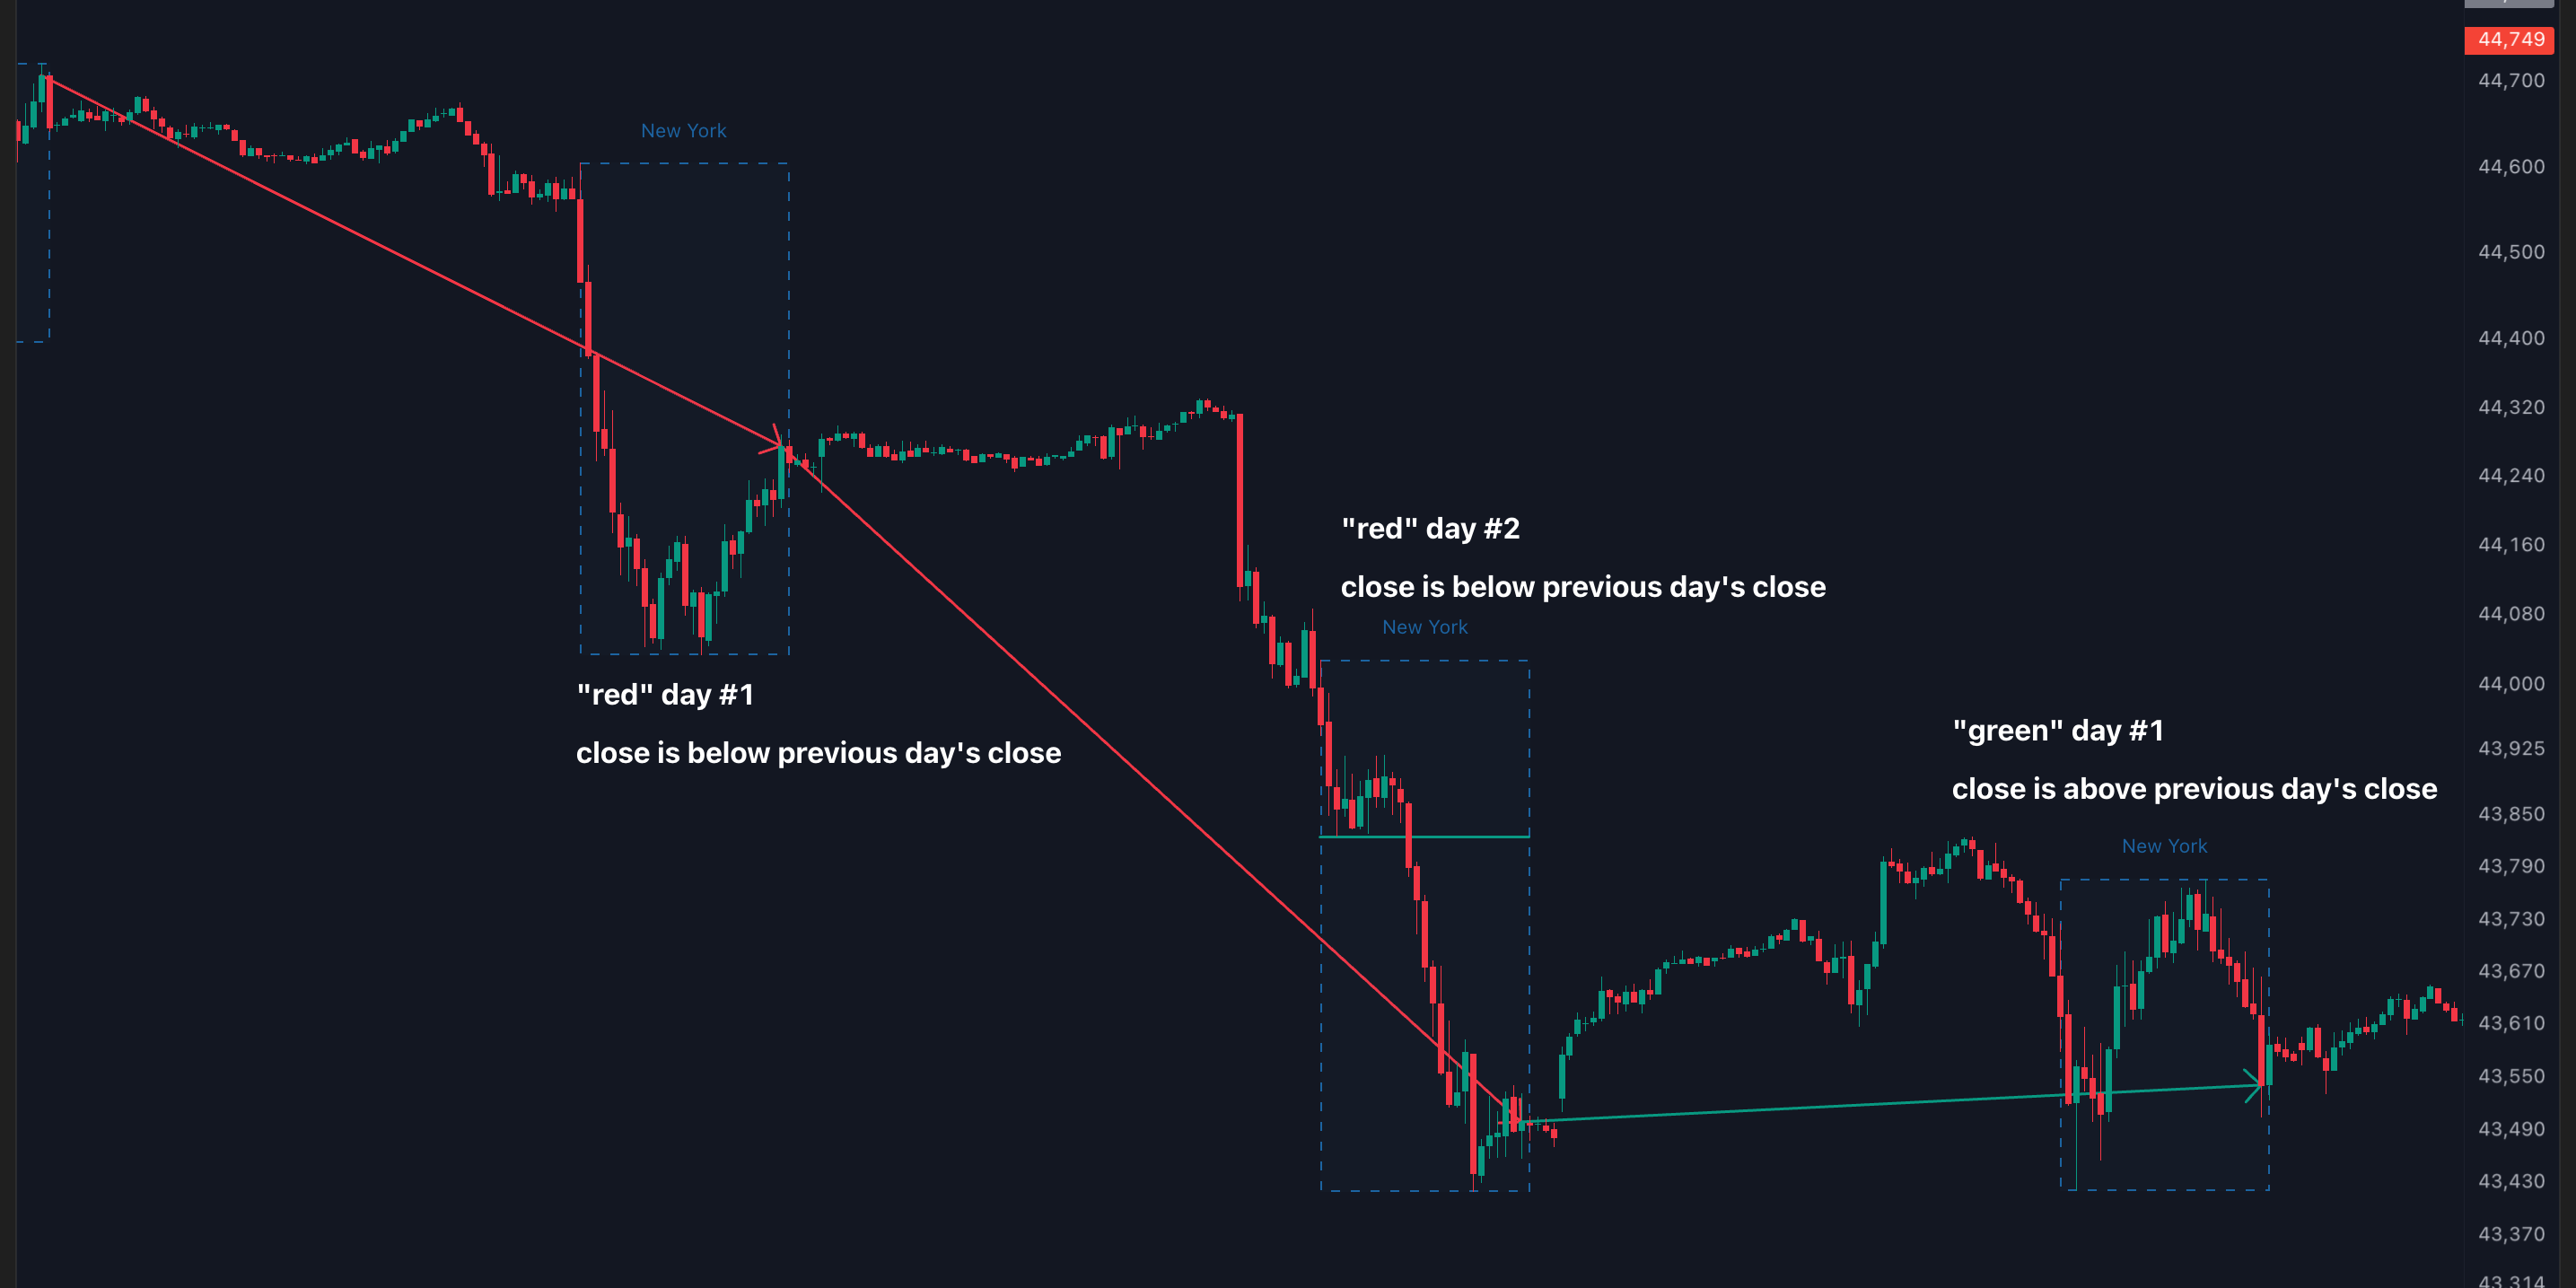
let's look at a real example from late February:

YM had 2 consecutive red days — February 20th and 21st. based on our streak data, we had already reached the average red day streak length, indicating that the probabilities for a reversal were increasing.
the next session, February 24th, YM broke the streak with a green day.
this example illustrates why subjective trading is so challenging. without data, you're left to make emotional decisions about when "enough is enough" with a trend. the green and red streaks report removes this guesswork, giving you concrete guidelines for when to expect reversals.
for day traders (using open-to-close)
day traders can use this report to develop a session bias before the market even opens:
- if you're day trading after 2 consecutive red days, have a bias toward longs
- if you're day trading after 2 consecutive green days, have a bias toward shorts
this doesn't mean blindly taking counter-trend trades — you still need confirmation from price action and other technical factors. the streak data simply gives you a bias and tells you where the probabilities lie.
the problem with subjective trading
I've spoken with thousands of traders, and one of the most common issues is inconsistency in deciding when to take profits or reverse positions.
relying on subjective methods — like taking profits "because you feel like it" or holding positions because "you think the move still has more" — will never lead to consistent results.
the green and red streaks report solves this problem by providing objective, data-backed criteria for making these decisions. instead of guessing or hoping, you're trading based on statistical probabilities derived from actual market behavior.
in the example we discussed earlier, as a swing trader, you would:
- get short on day 1
- hold overnight expecting continuation into day 2
- take profits near the end of day 2, knowing a reversal was statistically likely
- potentially look to get long for the expected reversal
this approach allows you to capture the majority of moves without the emotional rollercoaster of holding too long or exiting too early.
customizing the green & red streaks report for your trading
one key angle many traders miss is that streaks behave differently across various sessions and instruments. what works for YM during NY hours might not apply to ES during London hours.
in the green & red streaks report, you can customize:
- trading sessions — NY, London, Asia, Daily, or Custom
- session times to match your specific trading hours
- timeframes — daily, weekly, or monthly views
for example, if you primarily trade the London session, simply change the session dropdown to "London" to get data specific to the 3:00AM-11:00AM ET timeframe.

simplifying streak tracking with the sessions table
rather than manually tracking closes and calculating streaks yourself, use the table at the bottom of the green & red streaks report:

this table gives you:
- date
- day of the week
- color of the session based on your chosen calculation method
making it effortless to identify where we are in the current streak cycle.
building your green & red streaks trading plan
now that you understand what the report measures and how to customize it for your trading style, here's a step-by-step process for incorporating it into your daily routine:
- select the appropriate calculation method — swing traders use previous-close-to-close, day traders typically use open-to-close
- check the streaks report before your session begins — note the average streak length and current streak status
- count consecutive days — how many consecutive green or red days have we had?
- set your bias — if we're at 2 or more consecutive days on YM, have a bias toward a potential reversal
- look for confluence — combine this with other reports like opening candle continuation or previous day's range
- adjust your position sizing and targets — be more aggressive with reversal trades after streaks have extended beyond the average
by making this a regular part of your analysis, you'll develop a systematic approach to anticipating market turns.
the power of the 2-day rule
the consistent 2-day average for both green and red streaks on YM points to what I call "the 2-day rule".
this rule suggests that after 2 consecutive days in one direction, the probabilities start to favor a reversal. while not guaranteed (nothing in trading is), this statistical edge can dramatically improve your timing for both entries and exits.
the beauty of this approach is its simplicity. unlike complex technical indicators or chart patterns that require interpretation, the 2-day rule is objective and clear. either we've had 2+ consecutive days in one direction, or we haven't.
stacking the data in your favor
for maximum effectiveness, combine the green and red streaks data with other high-probability setups:
- opening candle continuation — does the first hour's direction align with or against the expected reversal?
- previous day's range — are we breaking important levels from the previous session?
- gap fills — is there an unfilled gap that could provide a magnet for price?
when multiple reports align to suggest the same direction, you can trade with even greater conviction.
wrapping up: data over emotion
the green and red streaks report exemplifies why data-driven trading is superior to emotional decision-making. by knowing that trends on YM typically reverse after just 2 days, you can:
- anticipate potential reversals before they happen
- take profits based on statistical probabilities, not gut feelings
- develop a data-backed bias for each trading session
- avoid getting caught in exhausted trends
the next time you're tempted to chase a multi-day move or hold onto a profitable position "just a little longer," check the green and red streaks report. the market might be telling you it's time for a reversal.
remember — successful trading isn't about being right all the time. it's about having a statistical edge and applying it consistently. the green and red streaks report gives you exactly that edge.
want to access our comprehensive data on market streaks and dozens of other high-probability trading patterns? explore our data-driven trading platform today.