edgeful's completely redesigned dashboard & trading experience
why we completely redesigned the edgeful platform
when it comes to trading with data, every second counts. that's why we've completely overhauled the edgeful platform to create a more intuitive, personalized experience that helps you visualize more data and make faster decisions.
our goal was simple: remove unnecessary clicks, put the most relevant data front and center, and give you complete control over what you see. the result is a trading platform that adapts to your needs, not the other way around.
let's walk through all the major improvements and show you exactly how they'll transform your trading process.
the new discover page: your personalized report hub
after a quick onboarding quiz that helps us tailor the experience to your trading style, you'll find yourself on the all-new discover page.

this is your central hub for exploring our extensive library of 100+ reports and sub-reports across stocks, forex, futures, and crypto. here's what you can do:
- choose your asset class — filter by stocks, forex, futures, or crypto
- select report types — narrow down to price action, volume, or indicator-based reports
- filter by trading style — find reports optimized for scalpers, day traders, or swing traders
- browse report categories — refine your search even further with specific categories
- scan results instantly — see all matching reports in the center of your screen
there is also a video walkthrough of the report discovery page, all you have to do is click the button in the upper right hand side of your dashboard!
once you find the perfect report for your trading style, you can:
- view the explainer to understand the report in detail
- bookmark it for quick access later
- jump directly to the report data
the discover page eliminates the old process of hunting through menus and remembering report names. now, everything is categorized, searchable, and just a click away.
what's in play: see what's setting up in real-time
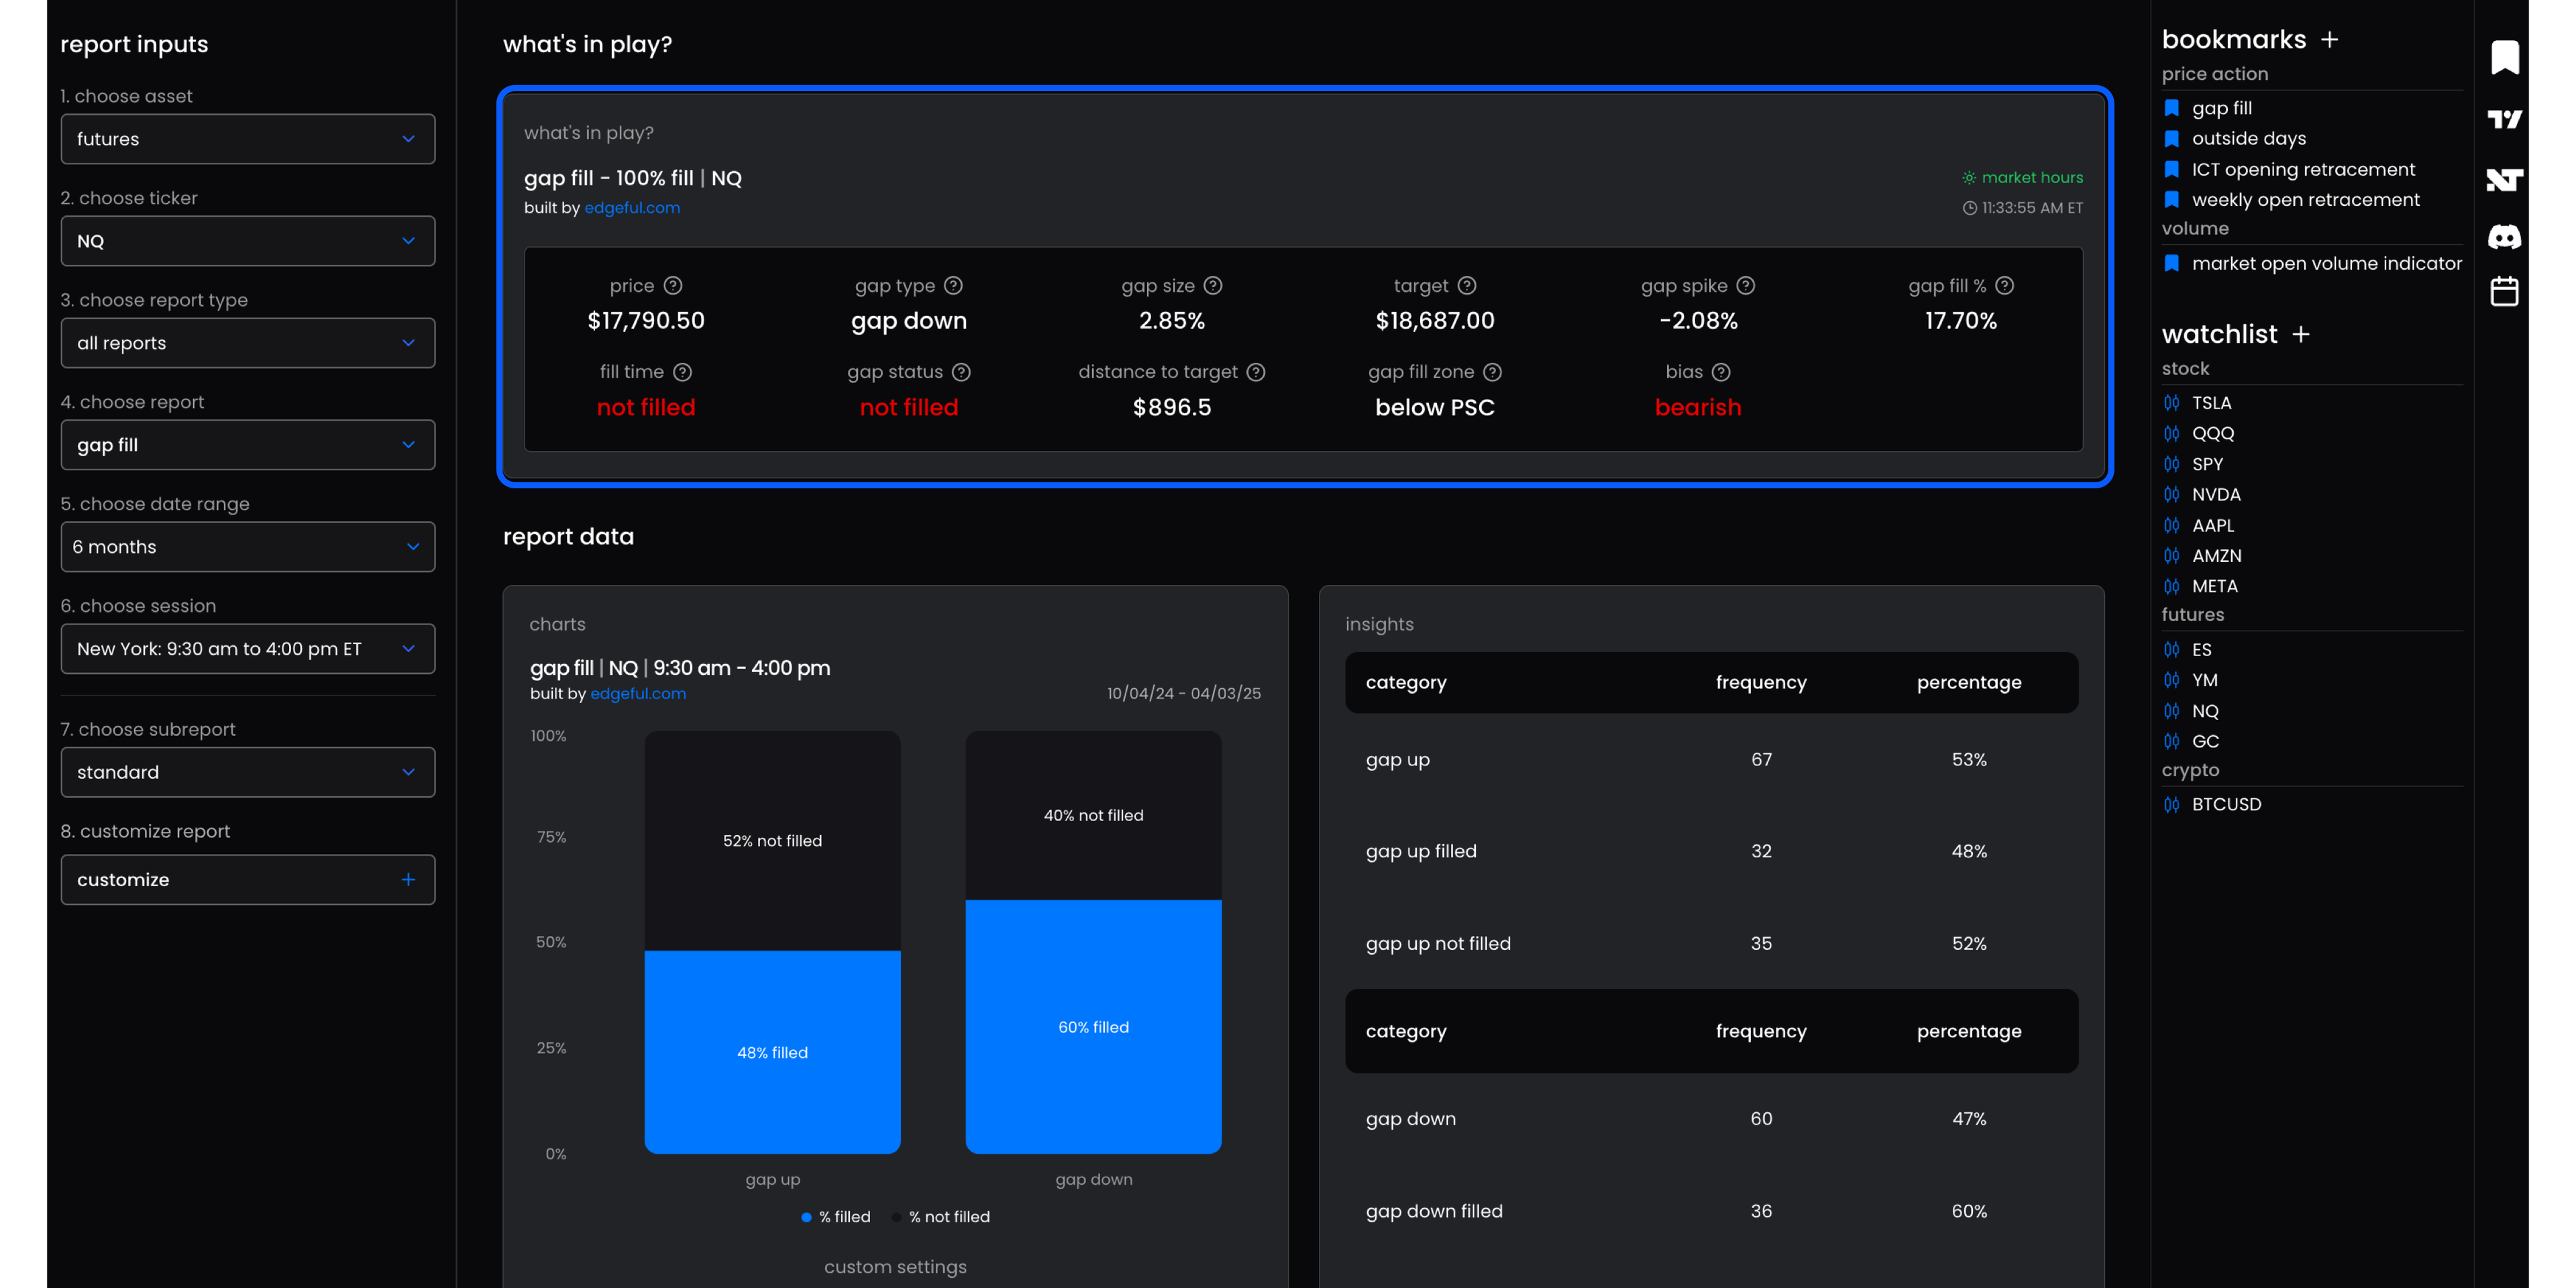
if you're serious about trading with an edge, you need to know what setups are setting up right now. that's where the improved what's in play tab comes in.

this dashboard gives you a bird's-eye view of all key reports for your favorite tickers, updating in real-time as setups develop throughout the trading day.
you can easily customize what you see by toggling specific reports on or off using the left sidebar. only interested in gap fills and opening range breakouts? no problem — hide everything else and focus on what matters to you.
the best part? what's in play automatically adapts to your watchlist. switch from ES to TSLA to NQ without missing a moment, analyzing only the most relevant reports for each ticker.
this real-time view eliminates the guesswork from your trading day. you'll know exactly which setups are forming across multiple instruments, allowing you to make informed decisions based on live data, not your opinion.
the what's in play screener: multi-ticker analysis at a glance
while the what's in play dashboard gives you depth on a single ticker, the what's in play screener provides breadth across multiple instruments simultaneously.

this powerful tool allows you to monitor how different tickers are behaving across several reports at once, giving you an unprecedented market overview that's impossible to achieve with traditional charting platforms.
how the screener transforms your market analysis:
multi-instrument tracking
instead of analyzing one ticker at a time, you can now track how up to 50 different instruments are setting up across your favorite reports. this gives you a bird's-eye view of market behavior, helping you spot sector rotations, correlated moves, and divergences.
custom report combinations
on the left side of the screener, you can select:
- your asset type — futures, stocks, or both
- your preferred tickers — currently 50 to choose from, with more being added regularly
- up to 4 reports to display — choose from 11 different reports like gap fill, initial balance, opening candle continuation, and more
developing a session bias
one of the most powerful applications of the screener is developing an overall market bias. for example, if you notice that by mid-session, the majority of major tickers haven't broken out of their initial balance range (which is rare based on the data), this indicates a neutral bias for the day.
instead of analyzing dozens of charts individually, the screener tells you everything you need to know in seconds. when there's clear momentum across multiple tickers, you'll see it immediately and can adjust your trading approach accordingly.
template creation for different trading sessions
you can also build custom templates of reports to analyze at different parts of the trading day:
- first hour templates — focus on gap fills, opening range breakouts, outside day patterns, and average daily range for quick morning trades
- midday templates — monitor different setups that typically play out during the middle of the session
- end of day templates — track power hour breakouts, opening candle continuation, and previous day's range to anticipate closing moves
the screener saves you countless hours of analysis by compiling all this data in one place and updating it in real-time as market conditions change.
bookmarks & watchlists: your trading command center
one of the biggest improvements to the edgeful platform is how we've streamlined the process of tracking your favorite reports and tickers.
in the old interface, you had to make multiple clicks to navigate between reports and instruments. now, we've created a comprehensive bookmarking system that puts everything at your fingertips.

creating personalized bookmarks
adding reports to your bookmarks is simple:
- click the "+" button to open the report discovery page (we covered the discovery page first in today's blog)
- browse or search for your favorite reports
- click the bookmark icon to add them to your bookmarks
your bookmarked reports appear in a convenient favorites bar that's accessible from every page in the platform.
building custom watchlists
similarly, creating watchlists is now faster and more intuitive:
- click the "+" button in the watchlist section
- search for your preferred tickers
- double-click or press enter to add them
your watchlists are fully integrated with both the what's in play tab and individual report pages. this means you can switch between instruments with a single click, instantly updating all the relevant data without having to navigate away or manually enter ticker symbols.

the reimagined reports page: where data meets action
the reports page has received a complete overhaul to make it easier than ever to find and act on key data points.

key improvements include:
1. what's in play integration
we've integrated the "what's in play" section directly into the report page, showing you how your favorite setup is shaping up in real-time. this means you can see the current market conditions without leaving the detailed report view.
2. streamlined sidebar controls
the new sidebar puts all essential controls in one place:
- timeframe selection
- session customization
- sub-report options
- data range filters
- and more
3. comprehensive data visualization
below the real-time data, you'll find:
- clean visual representations of historical data and probabilities
- detailed breakdown tables showing every instance of the pattern
- masterclass videos explaining how to interpret and trade the setup

4. quick access favorites bar
your bookmarked reports and watchlists are always visible in the favorites bar, making it easy to jump between different setups and instruments without losing your place.
5. TradingView indicator integration
we've also made it simpler to access our library of 35+ custom tradingview indicators, allowing you to apply the same patterns you're studying directly to your charts. just click the TradingView icon on the right side of your screen.
step 6: leverage your favorites
access your bookmarked reports and watchlists from the favorites bar, which is available on every page throughout the platform.
step 7: bring it to your charts
easily access our library of TradingView indicators to apply the same patterns you're studying directly to your charts.
getting started with your upgraded dashboard
when you log in to the new edgeful platform, you'll be guided through:
- a quick onboarding quiz to personalize your experience
- a brief walkthrough of the discover page and reports section
- tips for setting up your bookmarks and watchlists
within minutes, you'll have a completely customized dashboard tailored to your trading style, preferred instruments, and favorite setups.
the future of data-driven trading
this redesign is just the beginning. we're continuing to develop new features and improvements based on feedback from traders like you.
our mission is to give you the most efficient, effective trading process possible — one that eliminates guesswork and replaces it with data-backed decision making.
the new edgeful platform puts that mission into practice by giving you faster access to relevant data, more intuitive controls, and a personalized experience that adapts to your unique trading style.
ready to experience the upgrade?
if you're already an edgeful member, log in now to explore the new platform. if you haven't joined yet, there's never been a better time to start trading with real data instead of emotions.
we're making upgrades to our product every day to help you become a more effective trader. the question is: are you going to take advantage of these improvements, or are you going to keep waiting for "the right time"?
(spoiler alert: the right time is now.)
want to experience the new edgeful platform for yourself? start your free trial today and see how data-driven trading can transform your results.