how to detect shifting market environments before they destroy your trading edge
the market is always changing - are you?
it's hard to think about, but it's an idea every trader needs to face: what worked for you last year might not work for you this year. what may have worked last quarter may not even work this quarter...
the market is constantly changing and evolving (there are thousands of reasons for this!), and if you're not adapting your strategy to keep up, you're going to get left behind.
in this post, we'll look at how you can use report data to recognize when the market environment has shifted and your edge becomes less reliable, or worse, less profitable.
a quick look at some reports that have changed (over the past 3 months!)
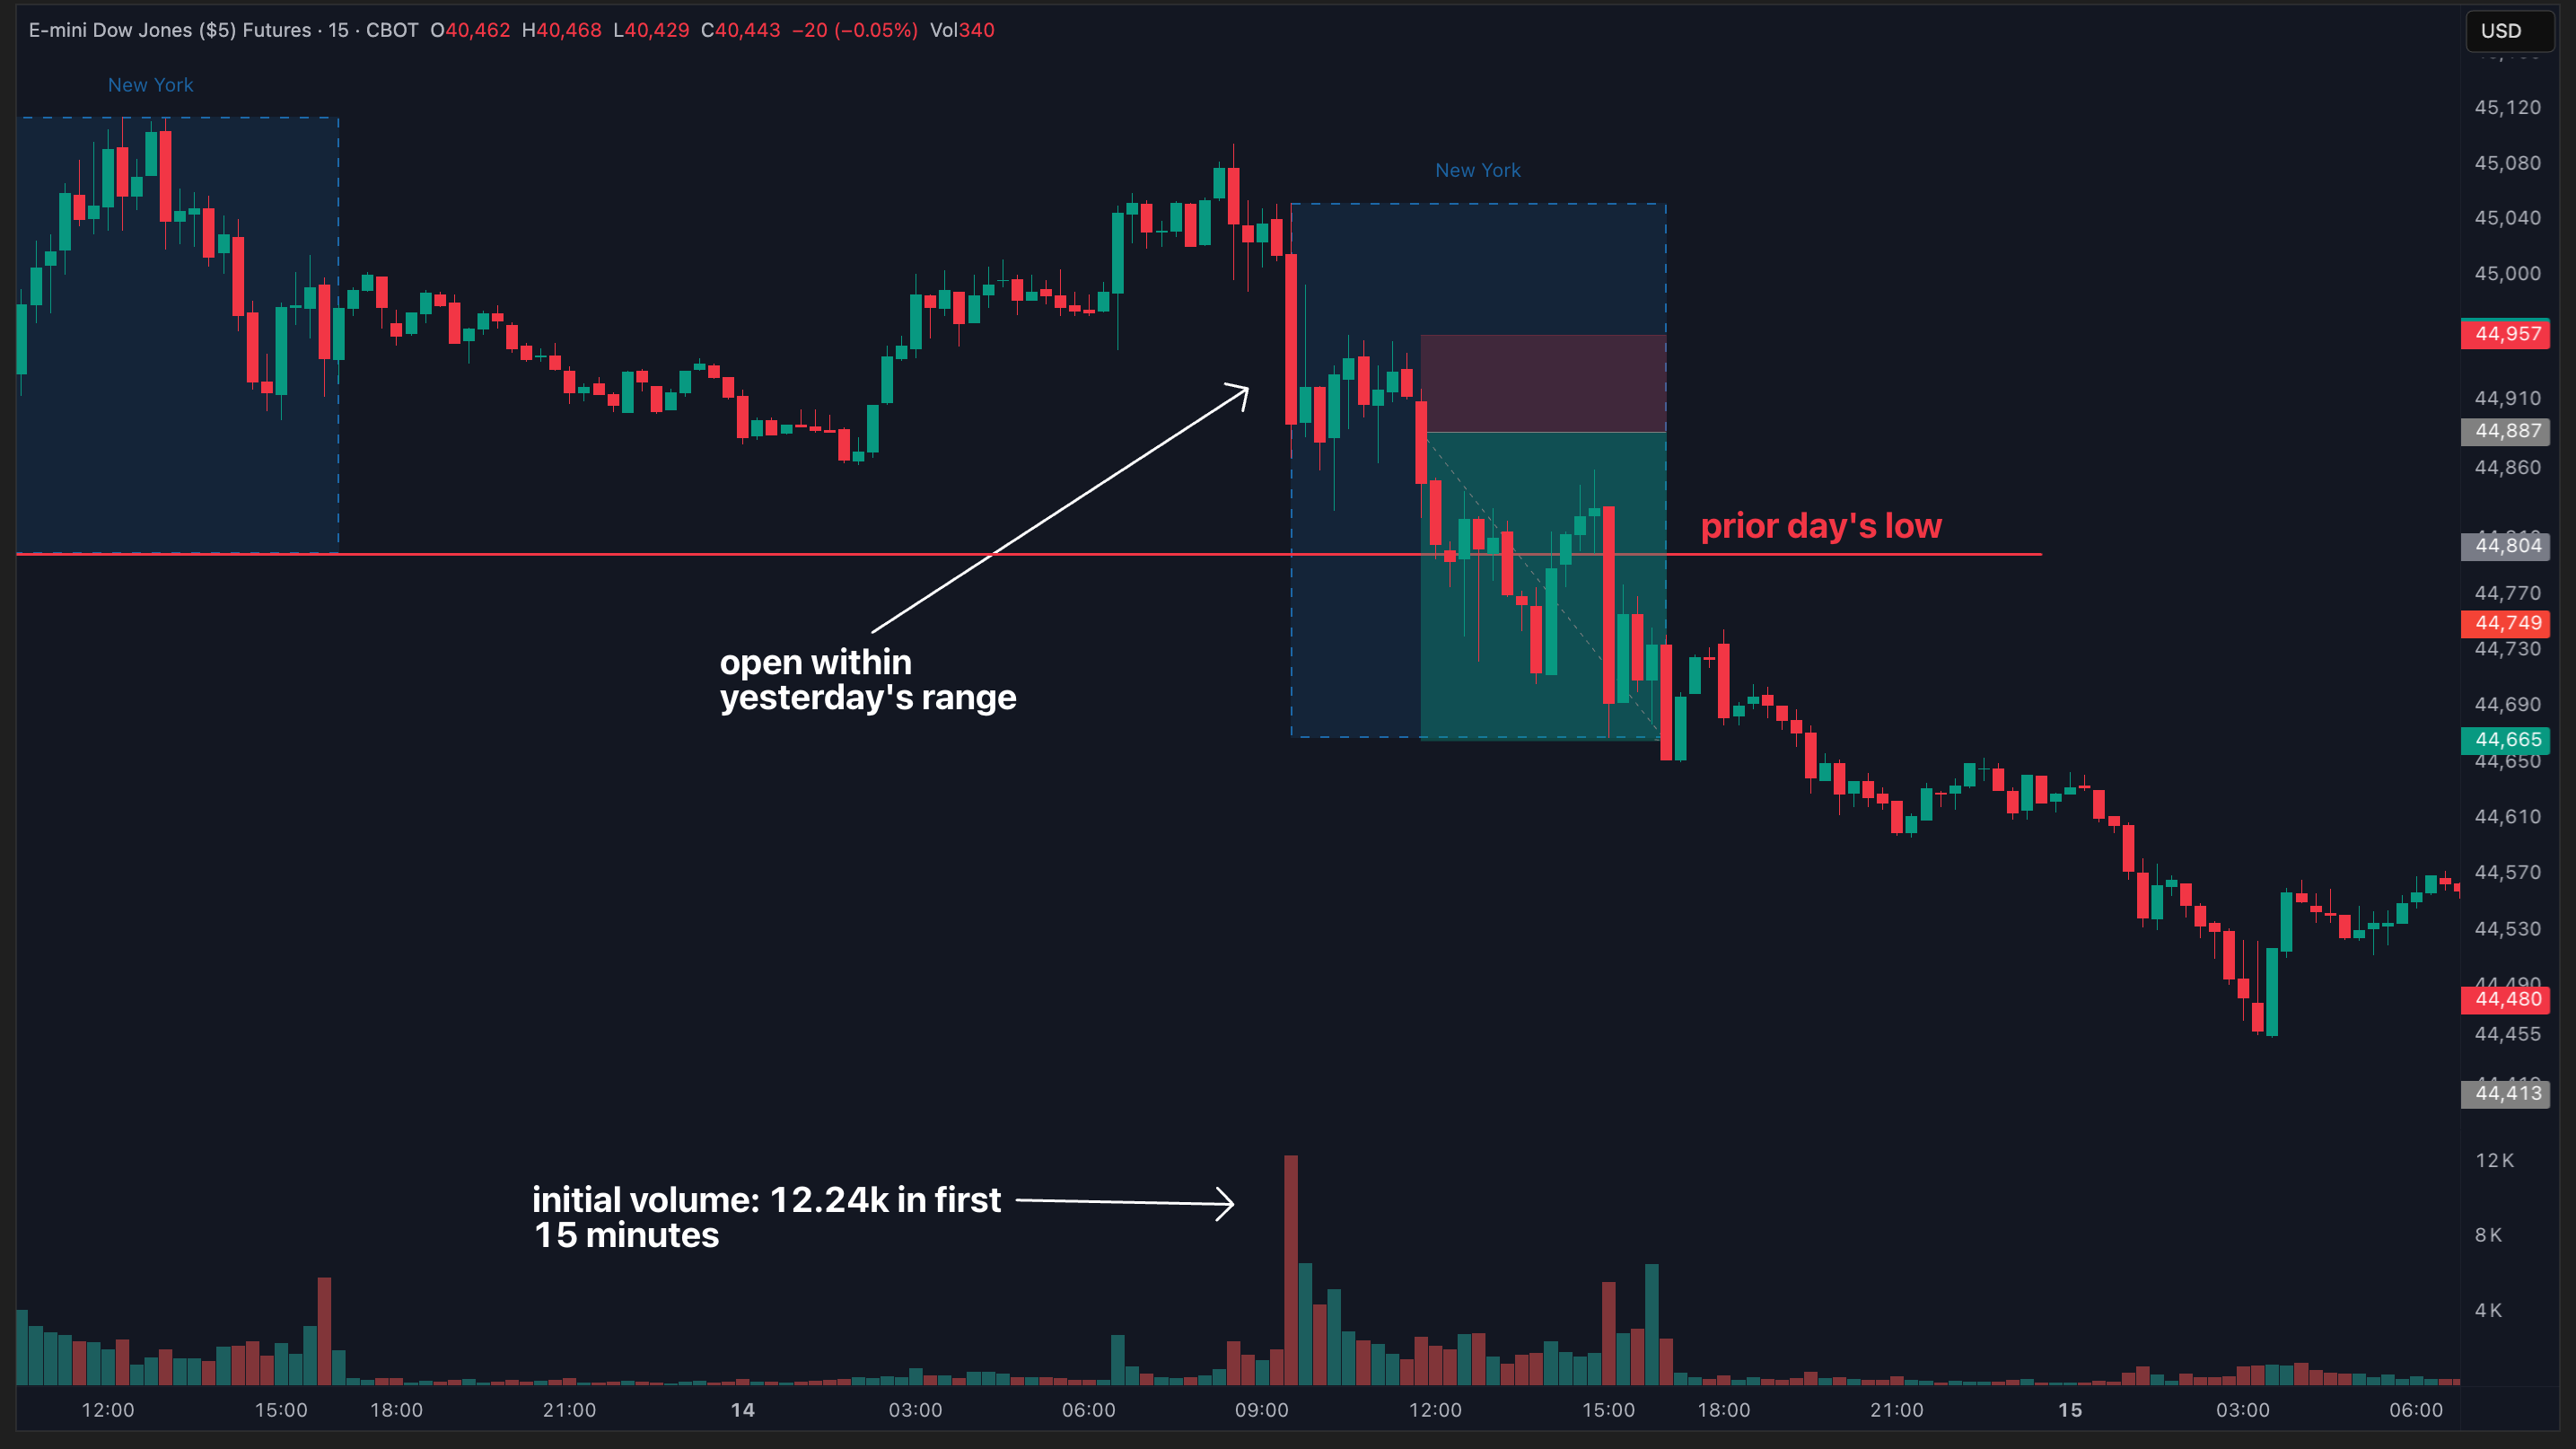
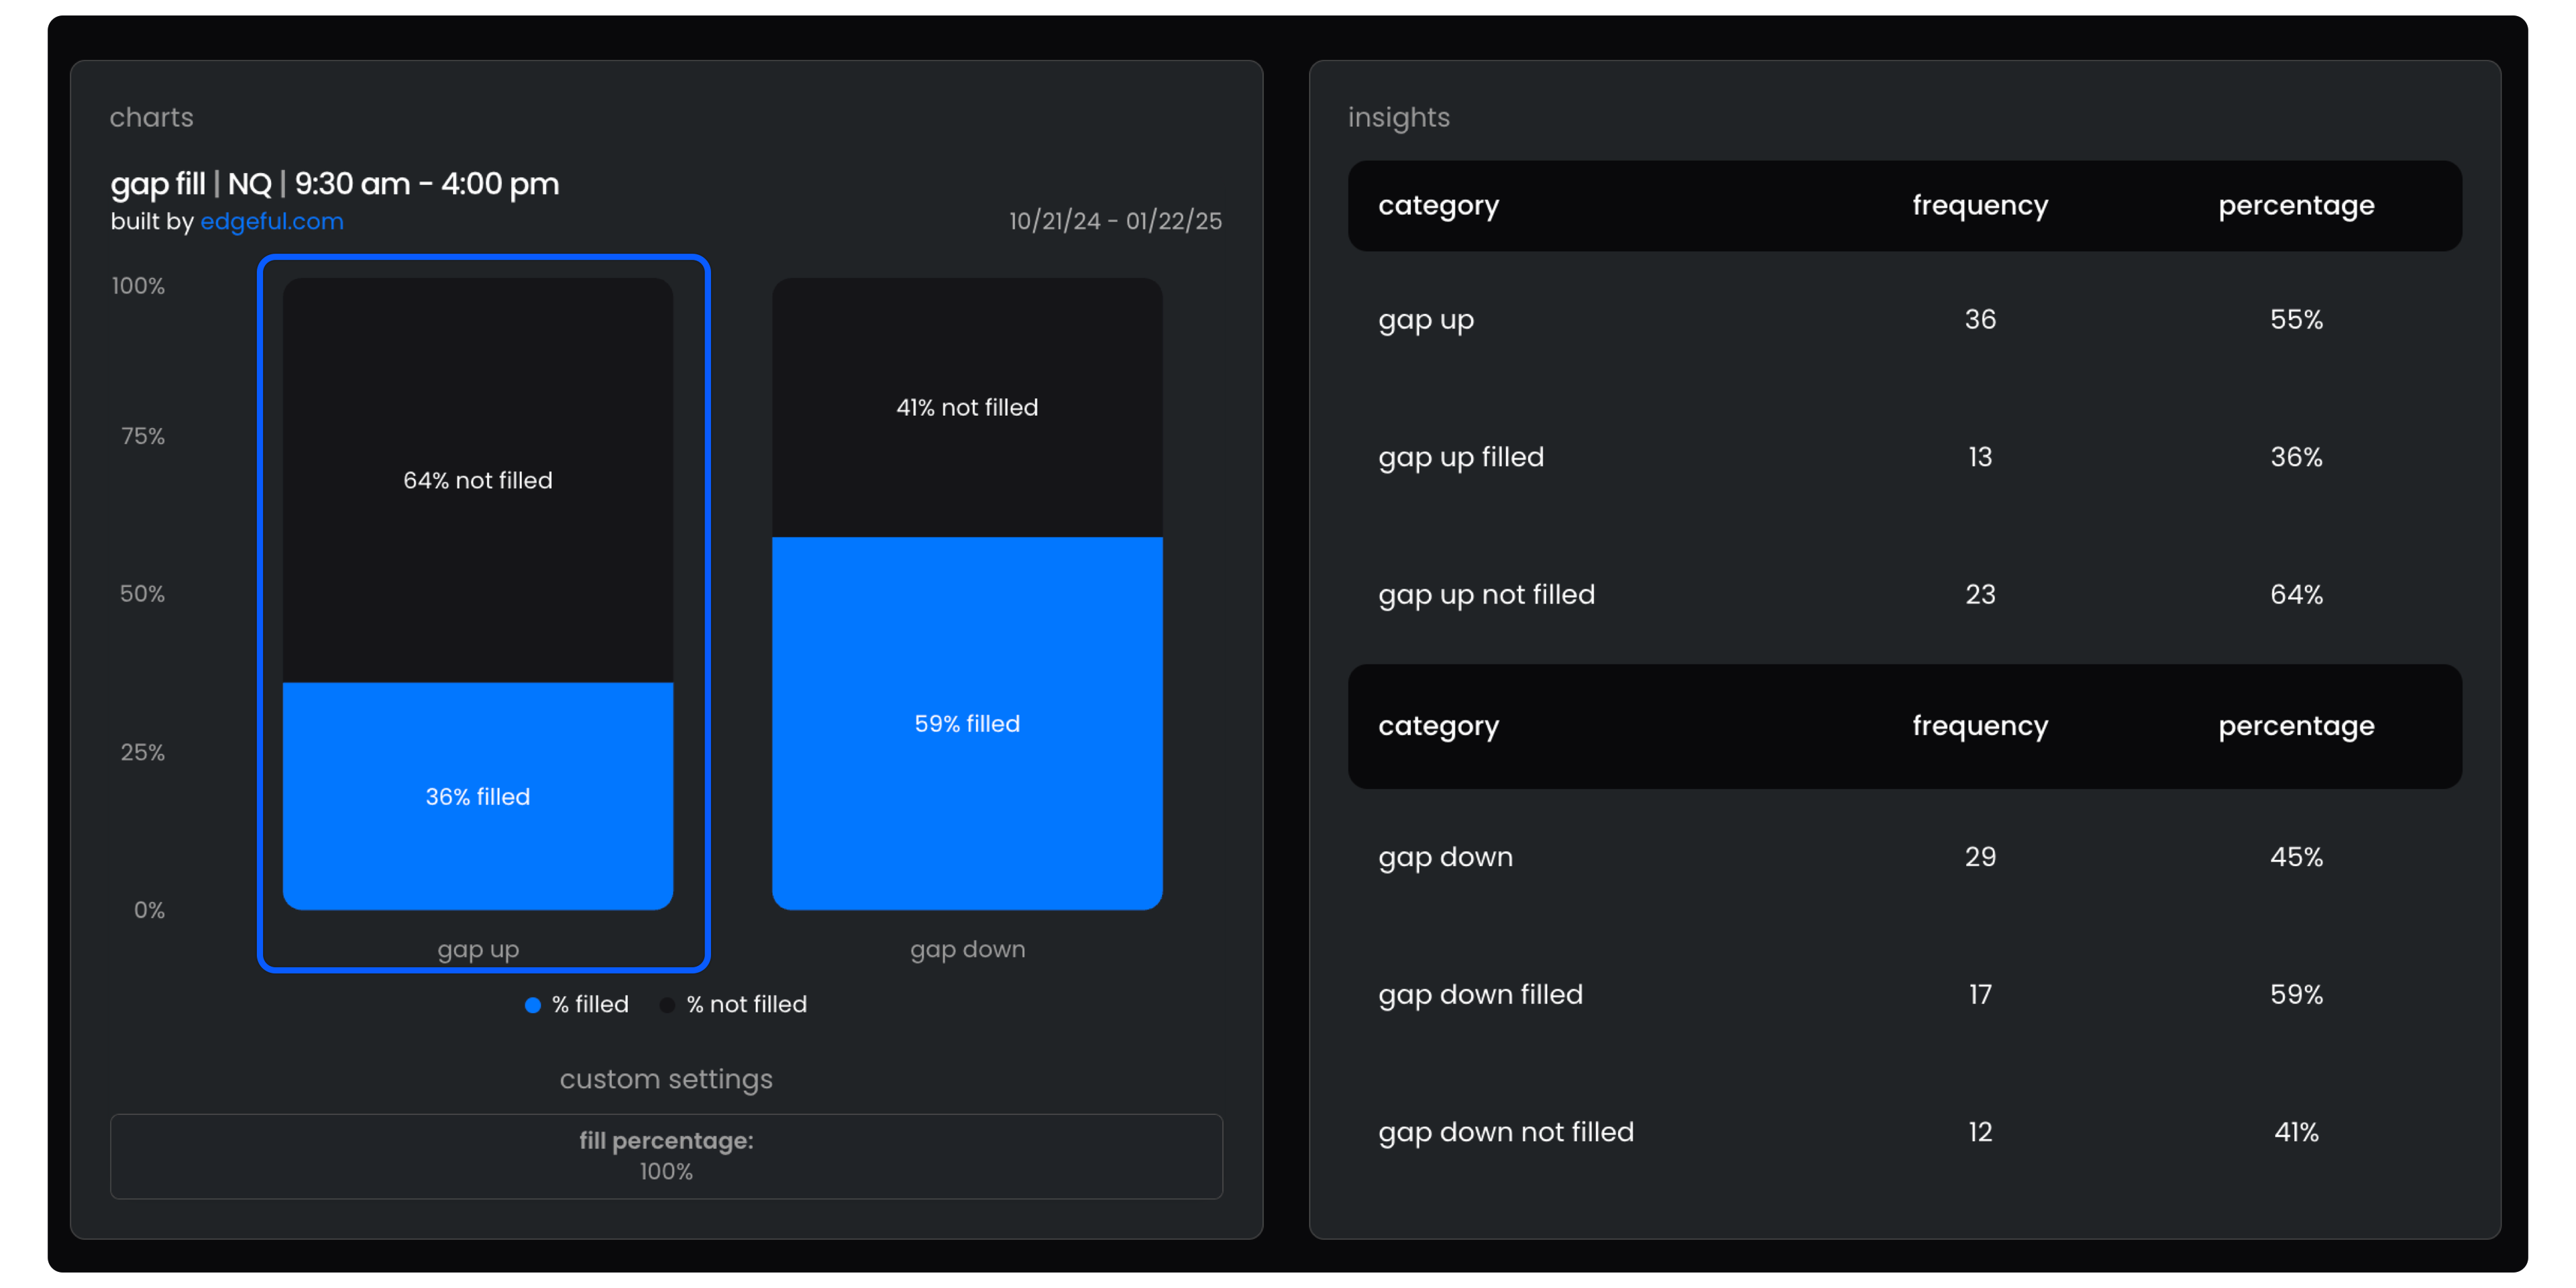
just look at the gap fill report using NQ as an example.

from Jan 1st, 2024 to July 1st, 2024 gaps on NQ filled 61% of the time. seems normal, right? and if you're a gap fill focused trader, it's likely you made a decent amount of money in 2024 (at least the first half of it) based on the data.

but if you look at the past 3 months, you'll see a completely different picture. now on NQ, gaps are only filling 36% of the time! a 25% difference between the two, which brings up the question that if you're trading gap fills exactly the same now as you were before…
are your results the same, better or worse? based on the data, they're likely worse…
okay, so that's the gap fill report. you can go through edgeful yourself and analyze how percentages across different tickers have changed over different timeframes for that report specifically.
but it's not just gap fills... here's another example with the 15-minute ORB setup on ES:

in the first quarter of 2024, double breaks occurred 81% (!!) of the time. this is as close to a sure trade as there is in the market…
but compare that data with the most recent 3 months…
double breaks only happening 51% of the time.

and by the way, if you're not familiar with what a single break, double break, or no break is on the ORB, you can read this article.
so what's the takeaway here?
to put it simply, your trading has to be dynamic with the market. you don't want to be setting targets that have no chance of hitting because data has changed, and you definitely don't want to take trades that have no chance of being profitable in the first place, all because the data has changed and you haven't.
so you can do one of two things…
- stubbornly stick to your strategy and never adapt, hoping things turn around (spoiler: they probably won't, and you'll probably lose a lot of money), or
- recognize that the environment has changed and pivot to adopt a new approach to keep up with the market.
the smart traders choose option 2.
and with the ability to filter the data over any period you want on edgeful, you never have an excuse to not adapt with the market, on literally any timeframe. you're the only one to blame if you continue to lose money trading a setup that's deteriorating.
we give you all of the tools & data you need to be successful as a trader — so why wouldn't you take advantage of them?
here's a real life example as to why being dynamic is so crucial:
as you may know, I hop on calls every week with edgeful subscribers. I usually give a walk through of the same report — and I caught myself going through the stats for a setup that at one point last year had nearly an 80% probability of working. then over the next few calls, those probabilities were at 78%, then 76%, and before I knew it, I was going over stats (for the same report) that now had a probability in the low 60s!
I was able to pivot my own trading to avoid this setup — realizing that I was watching the market environment shift in real-time, rather than relying on taking losses to see that the way I wanted to trade wasn't going to work.
and that's the real power of having a tool that allows you to track changes in the profitability of setups in real-time.
you're able to almost 'predict' what the market's going to do, something that very few platforms (if any at all, other than us) can actually help you do. it's not just about checking what happened 1 year ago and comparing it to what's happened 6 months ago — it's about realizing changes are happening every second, and positioning yourself to take advantage and profit from where the market is going in the future.
putting it all together
so, how can you start incorporating timeframe analysis into your own trading? here's our simple 3-step process, all made possible to you from edgeful:
- pick your top 3 strategies and find the relevant edgeful reports
- filter each report by 1-month, 3-month, 6-month, and 1-year timeframes
- note any significant changes in winrates or probabilities across timeframes
- is your edge holding steady or deteriorating?
- is there a new setup that's showing promise on the shorter timeframes?
- adjust your strategy accordingly
- pivot to higher probability setups
- tighten your rules for lower probability setups
- sit out completely if conditions are unfavorable
by regularly going through this process, you can ensure that you're always aligned with the current market environment, and are positioned to take advantage of where it's going in the future. you'll be able to quickly drop strategies that have lost their edge and capitalize on new ones as they come up.
sure, it takes a bit of extra work. but the payoff is huge. you'll avoid costly drawdowns, improve your overall profitability, and develop the skill of adaptability - which is everything for long term success as a trader.
so if you're tired of not being able to see where the market may go in the future, come try out edgeful.