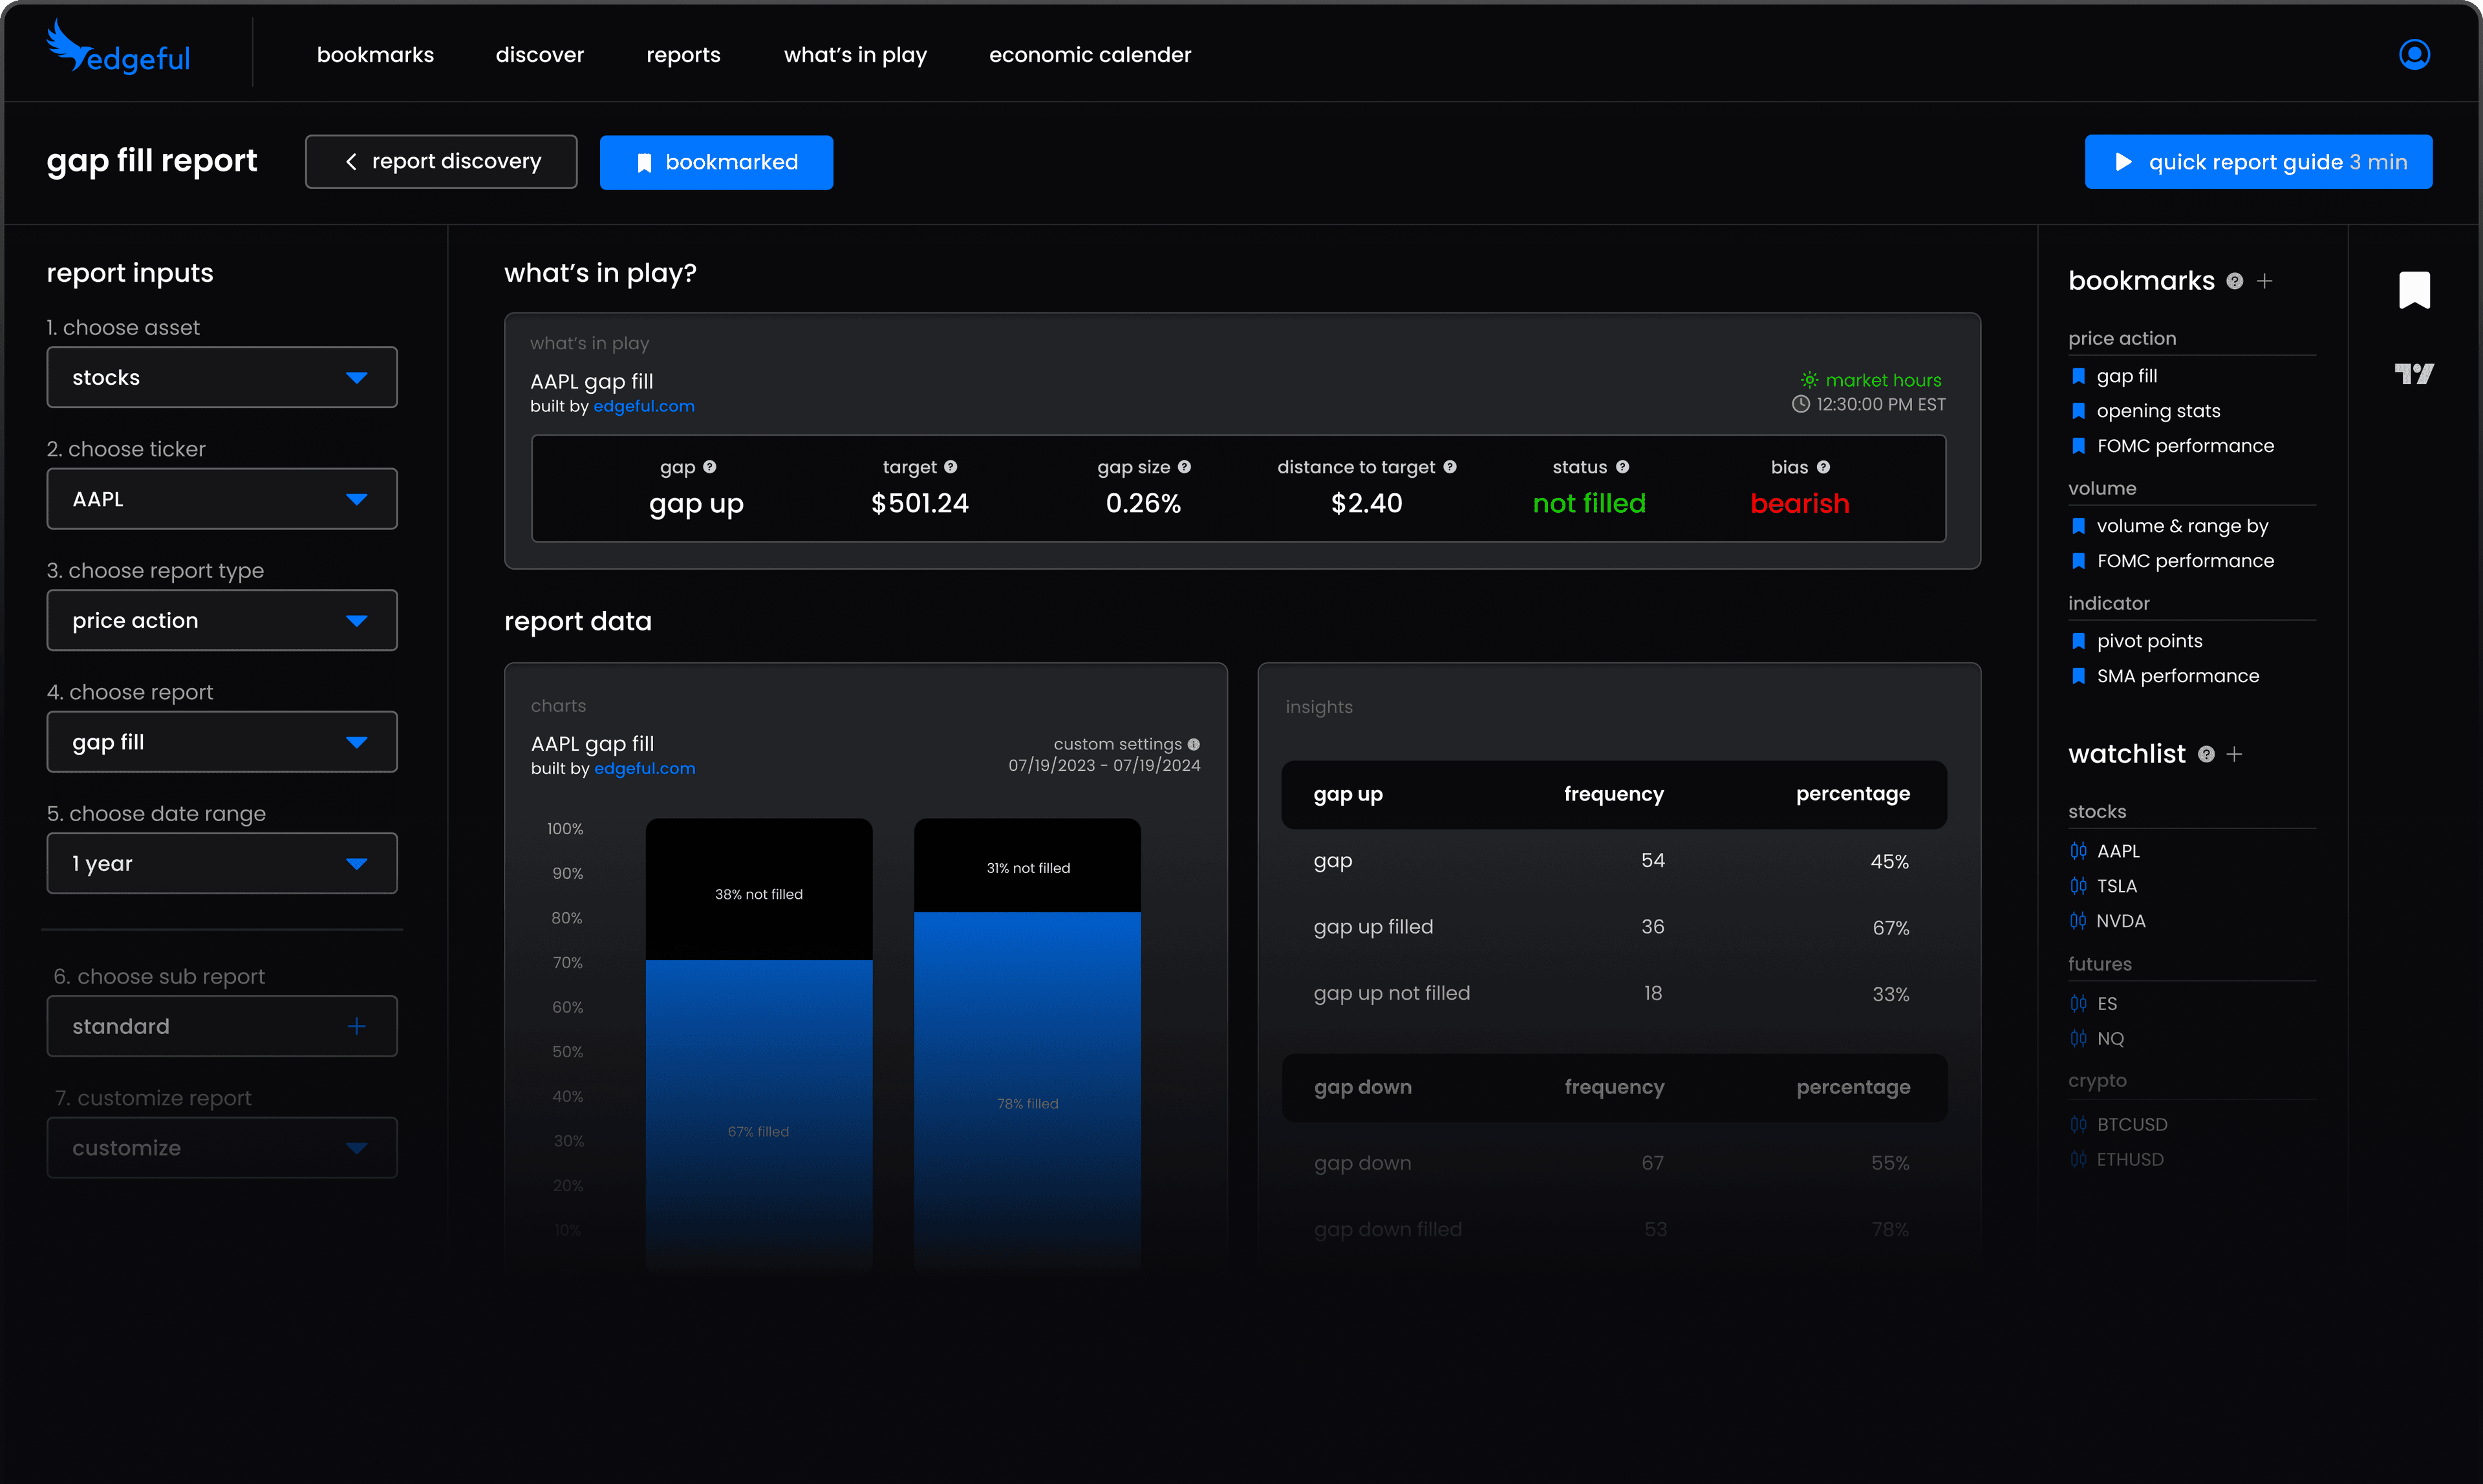
trade with data
not your emotions
technical analysis, made simple. the only tool you need to become consistent. we instantly give you an edge so you can focus on high probability setups.


WE'RE YOUR QUANT
what is edgeful?
edgeful is your personal financial analyst, simplifying market data into actionable reports. instantly see how any stock behaves, even down to specific weekdays, and find high probability setups, in seconds.
get startedANALYSIS, DONE FOR YOU
the reports
the ultimate toolkit for trading insights, featuring 150+ customizable reports on price action, trends, and strategies. organized for easy access, it's your go-to resource for confident, data-driven decisions.
get startedREAL TIME DATA
what's in play?
live data alerts for high-probability trades like gap fills and breakouts, with targets, probabilities, and biases—your real-time shortcut to actionable ideas.
get startedSEE THE MARKET CLEARLY
screener
get a data-backed bias across all your favorite tickers at once—scan live edgeful reports to instantly spot which setups are forming and where the edge is.
get startedUPGRADE REQUIRED
trading algos
fully automated execution. connect your broker so you never miss another A+ setup again — you can finally trade a consistent strategy. no noise. no guesswork. no hesitation.
learn more30+ CUSTOM INDICATORS
trading indicators
indicators that map key levels like session ranges and gap fills directly on your charts, keeping you focused on precise execution.
get startedYOU SAY IT, WE'LL BUILD IT
custom built reports
your strategies, built into edgeful. with custom report requests, we transform your trading ideas into actionable insights, empowering you to trade with confidence.
get startedPERSONALIZE YOUR EXPERIENCE
build your playbook
build your playbook with a personalized dashboard of reports and watchlists. save insights, track setups, and keep smarter trading just a click away.
get startedLESS THAN THE PROFITS OF ONE TRADE
where consistent trading begins
only if you're serious about trading
$
49
per month
get startedDON'T TRADE ALONE
join the community
daily pre-market preps, weekly webinars on how to use new features and reports, chart breakdowns, and mentorship from successful traders
join our community
TESTIMONIALS
join thousands of traders.
say goodbye to blown accounts - you've found your edge.
edgeful truly is a game changer for traders. no matter if you trade forex or stocks or futures, edgeful has you covered. I really love using the price action reports to help determine my daily bias when trading ES. thanks edgeful!

Austin
@austinsilverfx
I have loved using edgeful to better my decision making on the trading desk. men lie, women lie but the numbers do not. getting accurate data from edgeful has been a game changer for me.

James Bruce
@JamesBruce131
Honestly, I WISH I had edgeful at the beginning of my trading journey not only to understand quickly certain nuances about various markets and assets but to save me hours and hours of testing certain nuances to find out there's no edge or that there's an edge to explore.

Kieran Duff
@trader__duff
I started using edgeful once I had started trading futures funded accounts. I haven't had a red week in 13 weeks and followed back to back best months of the year in June and July! These reports keep it simple when you focus on the right ones each day and you stay disciplined with your edge. I truly use them every day trading the NY session and gives me that extra boost of confidence. I am looking forward to the reports evolving and getting even better! Stop leaving yourself in the dark and use these reports already.

Evan Dyer
@itsevandyer
edgeful's data reports have taken my trading to the next level. My entries and exits have improved greatly allowing me to capture a higher percentage of profits from my trades. The TradingView indicators have also made life so much easier as a fast paced futures trader!

Emperador Maximiliano
@EmpMaximiliano
THE STAY SHARP NEWSLETTER
A+ trading strategies sent to your inbox
we'll show you how to build consistent systems with actionable reports, setups, and stats.

DATA PROVIDERS
data you can trust
reliable insights start with reliable data. all of our reports are built using direct exchange feeds, so you can trade with confidence in.
get started
FAQS
frequently asked questions
looking for more? sign up for insider updates
© 2025 edgeful. all rights reserved
futures and forex trading contains substantial risk and is not for every investor. an investor could potentially lose all or more than the initial investment. risk capital is money that can be lost without jeopardising ones' financial security or life style. only risk capital should be used for trading and only those with sufficient risk capital should consider trading. past performance is not necessarily indicative of future results.
testimonials appearing on this website may not be representative of other clients or customers and is not a guarantee of future performance or success.
